Corpus Vitrearum Medii Aevi
Medieval Stained Glass in Great Britain
Your trail:
- Conservation
- Protective Glazing
Protective Glazing
(Stefan Oidtmann, Johanna Leissner and Hannelore Römich)
1. Introduction. The Current State of Protective-Glazing Technology and the Aims of This Study
1.1. Protective Glazing and the Preservation of Stained Glass
External protective glazing currently constitutes the most acceptable solution for the preservation of endangered historical church windows (CVMA 1990). It provides museum-like conditions in situ and avoids the necessity of invasive treatment of the glass itself. Apart from protecting against corrosion, external protective glazing can also provide protection against the elements, pollution and vandalism; in addition, it reduces the amount of heat lost from a building.
The installation of protective glazing and concomitant intervention in the profile of the stone window surround detract from the overall aesthetic impact of a building, but this must be accepted of necessity. However, such intervention can be justified by the protection afforded to stained glass in its original architectural setting.
Even so, experience has shown that the installation of protective glazing cannot prevent condensation from occurring on the surface of the original glass, and in some cases it even encouraged it, thereby increasing the rate at which the stained glass deteriorated. The construction of the support system on which the protective glazing is mounted and the ventilation of the interspace (the space between the new protective glazing and the original glass) are therefore crucial to the efficiency of any protective glazing.
1.2. Historical Overview of Protective Glazing
The earliest protective glazing generally mentioned in the literature is that installed at York Minster in 1861/62 (Frenzel 1982; Newton 1982). The purpose of installing this glazing was to provide better insulation: the original intention was not to protect the stained glass, but this was recognized as a welcome additional benefit. According to the latest research, the oldest example may have been the protective glazing installed at Orvieto between 1826 and 1886 (Marabelli, Santopadre and Verità 1993).
In 1897, the Oidtmann stained glass workshop provided protective glazing for the Romanesque stained glass in the small church at Lindena in the Brandenburg Marches (CVMA 1972; Frodl-Kraft 1973; Frenzel 1982; CVMA 1990). Since about the same time, two panels from this cycle have been kept in the Germanisches Landesmuseum at Nuremberg; a comparison between the in situ panels and those preserved in the museum shows hardly any differences in their condition, pointing to the high level of protection provided by the glazing system in Lindena.
The extent to which medieval glass had decayed became apparent when panels that were being stored during World War II were documented and their condition recorded photographically (Newton 1982). As a result, protective glazing was installed when the glass was reinserted wherever possible. Such measures were undertaken as early as 1946 in Switzerland (at the Minster in Bern). Protective glazing was only introduced in West Germany (BRD) in the early 1950s.
1.3. Types of Protective Glazing
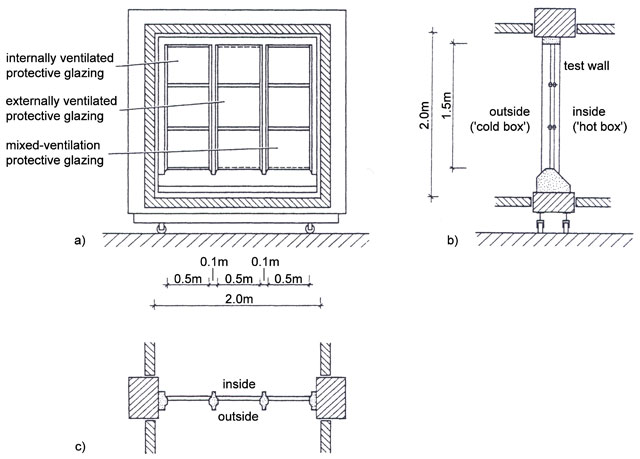
There are basically four different varieties of protective-glazing system: non-ventilated; externally ventilated; internally ventilated; and mixed-ventilation (fig. 1).
-
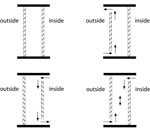
- Fig. 1. Types of ventilation system: (1) non-ventilated, (2) externally ventilated, (3) internally ventilated, and (4) mixed-ventilation systems
For a long time, the expression 'double glazing' was used to describe a non-ventilated glazing system where the interspace between the original glass and the protective glazing was completely sealed. The expression has since come to be used in architectural contexts to denote an insulating glazing system whose interspace contains dry air, so it is better and more correct to call use the expression 'non-ventilated protective-glazing system' for what was previously called double glazing. The expression 'external (or exterior) protective glazing' is used to denote an externally ventilated protective-glazing system, whereby an outer layer of either glass or synthetic material is mounted in front of the original glass, which remains in its original glazing grooves. Since the interspace is not closed to the outside, the outside air, replete with noxious substances, as well as rain can penetrate the space. It is rare for condensation to form in the interspace on the exterior face of the original glass, but it does occur on the internal face of the protective glazing.
'Isothermal protective glazing' is an internally ventilated system aimed at providing equalized climatic conditions on the inside and outside of the original glass, thereby protecting it from moisture such as rain and condensation. Such protective-glazing systems need to be sealed to the outside, and the interspace between the two layers needs to be ventilated from the interior. However, great care must be taken to ensure that the interspace is sufficiently ventilated in order to prevent the formation of condensation as far as possible, or at least limit its occurrence to the protective glazing.
In the so-called 'mixed-ventilation system', the interspace is ventilated with a combination of internal and external air. Installation is carried out in the same way as described for the 'pure' systems described above, but there are ventilation slits open to the outside as well as to the interior of the building. In many cases, this arrangement of ventilation slits has arisen unintentionally - either from the circumstances of a particular building, or out of ignorance on the part of an architect - with systems that were planned with internal or external ventilation ending up with mixed ventilation.
The position and size of the ventilation openings are important for all ventilated systems. Distinction must be made between occasions when low-level ventilation is required (achieved with narrow gaps or slits), or when high-level ventilation is necessary (achieved with wider slits). The ventilation openings can be positioned in a variety of ways, and glazing systems that are open on all sides should provide swift and effective air exchange. However, openings in form of slits are generally sited at sill level and at the uppermost panel of any light, an arrangement that achieves efficient air exchange through the so-called 'chimney-effect'. Sometimes through ignorance or building-related problems, slits are sited only at the head of the light, or at sill-level, or at the sides; this can restrict the ventilation of the interspace severely.
Types of Installation
There are basically three different methods for constructing protective glazing, the particular method being dependent on financial constraints and the specific building for which the protective glazing is intended:
- with the original glass in its original glazing groove and protective glazing fitted externally (usually externally ventilated);
- with the original glass moved inwards and the protective glazing fitted into the original glazing grooves (usually internally ventilated);
- with the original glass moved inwards and the protective glazing fitted externally (usually a mixed-ventilation system).
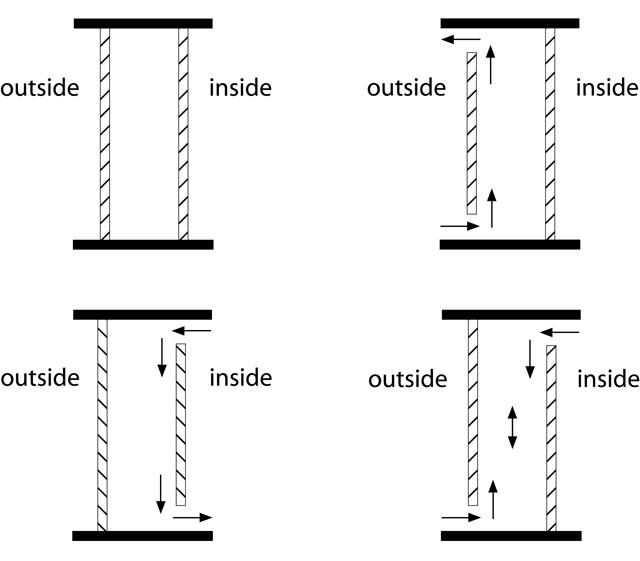
The original glass and the protective glazing can be secured in a variety of ways for all three methods (Oidtmann 1994; Oidtmann 1997) (fig. 2). However, the decision to use one particular method of construction does not automatically determine the type of ventilation, though each method is geared towards a particular type.
-
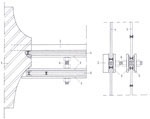
- Fig. 2. Horizontal and verticals sections of an internally ventilated protective-glazing system: (1) stone window frame, (2) saddle bar, (3) protective edging, (4) protective glazing, (5) original glass, (6) bolt bar and nuts.
The Form of the Protective Glazing
The most commonly used form of protective glazing is a single layer of glass, usually float glass, toughened glass, laminated glass, or machine-drawn restoration glass. Occasionally, special types of glass are used to prevent distracting reflections bouncing off the surfaces of the glass; however, in the majority of cases these types have been found to bring only slight improvement. The various types of leaded glass used for protective glazing, chosen for aesthetic reasons, also have disadvantages, because of the shadows created by the lead-net (Oidtmann 1994; Oidtmann 1997).
1.4. Previous Research into Protective Glazing
In Situ Surveys
Over the past few years, climatic conditions have been measured at a variety of locations in different European countries with protective glazing. The earliest German surveys were those undertaken at the Minster in Freiburg (1970-80). During 1974 and 1975, measurements were taken continuously at various heights in two different windows of the air temperature and the relative humidity inside and outside, as well as the surface temperature of the original glass and protective glazing (Geis 1976; Rönicke and Rönicke 1976). Further surveys were undertaken at the Church St Elizabeth in Marburg, as well as at the Church of St Lawrence in Nuremberg in the 1970s. Between 1977 and 1980, a study of the environmental damage to twenty-six stained glass windows was undertaken (commissioned by the Department of the Environment), but the protective glazing was not assessed ( it had only been installed in some cases) (Frenzel 1982; Fitz, Fitz-Ulrich, Frenzel, Krüger and Kühn 1984).
Outside West Germany climatic surveys of external protective-glazing systems were undertaken in Great Britain (at York, Sheffield and Canterbury); in Switzerland (at Königsfelden, Kloster Wettingen and Lausanne); in Austria (at Straßengel); in the Netherlands (at Gouda, Edam, de Rijp and Schermerhorn); in France (at Reims, Troyes, Chartres and Tours); as well as in Italy (at Orvieto). Their aims and results, as far as they are known and published, are summarized in the final reports (Oidtmann 1994; Oidtmann 1997).
Glass-Sensor Studies
Glass sensors constitute an alternative to surveys of climatic conditions in assessing protective glazing. These were developed between 1986 and 1988 at the Fraunhofer-Institut für Silicatforschung (the Fraunhofer Institute for Silicate Research) in Würzburg (see section 4 below). Special sensitive glasses are used as 'dosimeters'; these do not collect individual data, but summarize the corrosive impact of the environment at the point where they are sited. Glass sensors were used to assess external protective-glazing systems in an international study in 1989'90 on the recommendation by the Corpus Vitrearum Medii Aevi (CVMA) (Leissner and Fuchs 1992a and 1992b; Fuchs and Leissner 1992). Further projects followed, such as those at Canterbury (1991), Oppenheim (1991), Barcelona (1991), Assisi (1994), and Léon (1996).
The glass-sensor method has been patented (Fuchs, Patzelt and Tünker 1989), and standardized by the German Engineering Association (VDI Richtlinie 3955, Blatt 2). There are numerous publications comparing the results of individual glass-sensor studies (Fuchs, Römich and Schmidt 1991; Fuchs, Römich, Tur and Leissner 1991; Fuchs and Leissner 1992; Leissner and Fuchs 1992a; Leissner and Fuchs 1992b; Leissner 1994; Römich, Fuchs and Leissner 1998).
1.5. Aims of this Study
The previous sections have given an overview of the variety of protective-glazing systems used in different circumstances. Climatic surveys have shown that the installation of protective glazing can not only prevent condensation on the surface of the glass, but on occasion can also encourage it, which in turn accelerates the destruction of stained glass. Glass-sensor studies indicate that the type of ventilation chosen for the interspace is crucial in determining the effectiveness of the protective glazing.
Until now, it has not been possible to detect specific trends from the individual sets of measurements taken. For the purposes of the present study, an extensive programme of measurements was therefore devised for the first time in order to determine the influence on the effectiveness of protective glazing of the type of ventilation, the size of ventilation slits, the characteristics of the building (e.g., window size), as well as the exterior and interior climate of the building. In situ measurements and glass-sensor studies were undertaken simultaneously at selected locations, in order to combine the results of both methods. The research programme was enhanced by measurements in a climate chamber and by building computer models for the measurement of climatic conditions.
2. Description of the Windows Selected for Study
In general, the effectiveness of protective-glazing systems was tested at locations where these systems had already been installed. Only at the church in Keyenberg, which did not previously have any protective glazing, were differently ventilated systems installed at one window in order to be able to draw direct comparisons. Between 1990 and 1996, four survey campaigns were undertaken, each covering the cycle of a year.
2.1. Outline of the Windows Surveyed
Locations and windows were selected according to different criteria, so that each of the parameters that could influence the effectiveness of protective glazing could be varied in logical steps.
For the first two survey periods (1990-91 and 1991-92), churches from the same climate zone (the Rhineland) were chosen: the cathedrals in Altenberg and Cologne, and churches in Mönchengladbach (Hardt, Hermges, and the Minster), Keyenberg, Lamersdorf, Rheydt-Giesenkirchen and Breinig. During the first survey period, mainly north- and east-facing windows were surveyed, and during the second survey period mainly south-facing ones, though measurements were taken each time for comparison from the window of the other orientation. In addition to conducting surveys on windows where protective glazing had been installed, one north-east-facing window at Keyenberg was specially prepared so that comparative measurements could be taken with different ventilation systems; these measurements were taken during the first and second survey periods.
Only two locations were chosen for the third survey period (1992-93). In the church at Kloster Neuendorf three differently oriented protective-glazing systems were examined, and at Cologne Cathedral comparative measurements were made from north windows with differently constructed and ventilated protective-glazing systems. During the fourth survey period, some buildings where exceptional circumstances obtain were examined: Erfurt Cathedral (where there was severe corrosion of the medieval windows); the Gotisches Haus ('Gothic House') in Wörlitz (where there are extreme temperatures during summer); and Augsburg Cathedral (where the interspace between original glass and the protective layer was heated).
| Survey location | Window (orientation) | Survey period | Ventilation type |
|---|---|---|---|
| Altenberg Cathedral | nXV (north) | 1990-91 | mixed |
| nIV (south-east) | 1990-91 | mixed | |
| Augsburg Cathedral | Prophet Daniel | 1995-96 | internal, non-heated |
| Prophet Hoseas | 1995-96 | internal, heated | |
| Breinig, Church of St Barbara | sIX (south-west) | 1991-92 | non-ventilated |
| Erfurt Cathedral | nV, lights b and c (north) | 1995-96 | internal |
| sV, lights b and c (south) | 1995-96 | internal | |
| Keyenberg, Holy Cross | nII, light a (north-east) | 1990-91 | none: original state |
| nII, light b (north-east) | 1990-91 | external | |
| nII, light c (north-east) | 1990-91 | internal | |
| nII, light a (north-east) | 1991-92 | mixed | |
| nII, light b (north-east) | 1991-92 | external | |
| nII, light c (north-east) | 1991-92 | internal | |
| nVII, light a (north) | 1991-92 | external | |
| nVII, light c (north) | 1991-92 | internal (measurement only) | |
| sVII, light a (south) | 1991-92 | external | |
| sVII, light c (south) | 1991-92 | internal (measurement only) | |
| Kloster Neuendorf | nIV (north) | 1992-93 | internal |
| eI (east) | 1992-93 | internal | |
| sIV (south) | 1992-93 | internal | |
| SII (south) | 1992-93 | internal | |
| Cologne Cathedral | eI (east) | 1990-91 | internal |
| sXXII (south) | 1990-91 | internal | |
| eI, lights a and b (east) | 1991-92 | internal | |
| sXXII, light c (south) | 1991-92 | internal | |
| sXXII, light a (south) | 1991-92 | internal (sensors only) | |
| nXXII, lights a, b and d (north) | 1992-93 | internal | |
| NXIII (north) | 1992-93 | internal | |
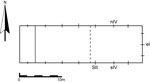
| NV, light a (north) | 1992-93 | internal | |
| NV, light c (north) | 1992-93 | external | |
| Lamersdorf, Church of St Cornelius | sIV (south) | 1991-92 | internal |
| Marburg, Church of St Elizabeth | nII (north-east) | 1990-91 | internal (measurement only) |
| Mönchengladbach, Minster | EI (east) | 1990-91 | mixed |
| Mönchengladbach (Hardt) | nII (north-east) | 1990-91 | internal |
| Mönchengladbach (Hermges) | sI (south) | 1990-91 | internal |
| Oppenheim, Church of St Catharine | SVIII (south: rose window) | 1991-92 | internal |
| Rheydt-Giesenkirchen, Church of St Gereon | eIV (east) | 1991-92 | internal |
| sI (south) | 1991-92 | internal | |
| wIV (west) | 1991-92 | internal (sensors only) | |
| Kloster Wienhausen | 5th south cell lights a and c | 1995-96 | internal (sensors only) |
| All Saints Chapel, nII | 1995-96 | internal (sensors only) | |
| All Saints Chapel, nII | 1995-96 | internal (sensors only) | |
| Wörlitz, Gotisches Haus | Kriegerisches Kabinett, eXXIII | 1995-96 | internal |
| Kriegerisches Kabinett, sXXIV | 1995-96 | internal | |
| Geistliches Kabinett | |||
| sXXVI, light a | 1995-96 | none: original state | |
| sXXVI, light b | 1995-96 | internal |
2.2. Description of the Windows Surveyed
The following description only covers the three locations for which the results are given in sections 3 and 4 below. The most important data are summarized in table 2. For a detailed description of all the windows outlined in table 1, as well as a full evaluation of the data gathered in situ and of the glass-sensor studies, see the final reports of the individual studies (Leissner and Fuchs 1995; Oidtmann 1997).
| Survey site | Window (Orientation) | Survey Period | Ventilation System | Width of Interspace | Ventilation Slit at Head of Light (at Sill Level) | Type of Protective Glass | Size of Lights |
|---|---|---|---|---|---|---|---|
| Keyenberg, Holy Cross | nII, light a (north-east) | 1990-91 | none: original state | - | - | - | 0.40m × 3.50m |
| nII, light b (north-east) | 1990-91 | external | 4.0cm (2.5cm) | outside 1.0cm (outside 1.0cm) | laminated | 0.40m × 3.50m | |
| nII, light c (north-east) | 1990-91 | internal | 4.0cm (2.5cm) | inside 1.0cm (inside 1.5cm) | float glass | 0.40m × 3.50m | |
| nII, light a (north-east) | 1991-92 | mixed | 4.0cm (2.5cm) | inside 1.5cm (inside 2.0cm) | float glass | 0.40m × 3.50m | |
| nII, light b (north-east) | 1991-92 | external | 4.0cm (2.5cm) | outside 1.0cm (outside 1.0cm) | laminated | 0.40m × 3.50m | |
| nII, light c (north-east) | 1991-92 | internal | 4.0cm (2.5cm) | inside 1.0cm (inside 1.5cm) | float glass | 0.40m × 3.50m | |
| nVII, light a (north) | 1991-92 | external (measurement) | 4.0cm (2.5cm) | outside 1.5cm (outside 1.5cm) | float glass | 0.40m × 3.50m | |
| nVII, light c (north) | 1991-92 | internal (measurement) | 4.0cm (2.5cm) | inside 1.5cm (inside 1.5cm) | float glass | 0.40m × 3.50m | |
| sVII, light a (south) | 1991-92 | external (measurement) | 4.0cm (2.5cm) | outside 1.5cm (outside 1.5cm) | float glass | 0.40m × 3.50m | |
| sVII, light c (south) | 1991-92 | internal (measurement) | 4.0cm (2.5cm) | inside 1.5cm (inside 1.5cm) | float glass | 0.40m × 3.50m | |
| Kloster Neuendorf | nIV (north) | 1992-93 | internal | 5.5cm (4.0cm) | inside 2.0cm (inside 3.0cm) | leaded | 0.50m × 4.40m |
| eI (east) | 1992-93 | internal | 5.5cm (4.0cm) | inside 2.0cm (inside 2.5cm) | leaded | 0.60m × 6.20m | |
| sIV (south) | 1992-93 | internal | 5.5cm (4.0cm) | inside 2.0cm (inside 3.0cm) | leaded | 0.50m × 4.40m | |
| SII (south) | 1992-93 | internal | 5.5cm (4.0cm) | inside 1.0cm (inside 1.0cm) | leaded | 0.55m × 1.75m | |
| Cologne Cathedral | eI (east) | 1990-91 | internal | 7.5cm (7.0cm) | inside <0.5cm (inside <0.5cm) | laminated | 0.95m × 9.40m |
| sXXII (south) | 1990-91 | internal | 7.5cm (7.0cm) | inside <0.5cm (inside <0.5cm) | laminated | 1.15m × 7.50m | |
| eI, light a (east) | 1991-92 | internal | 7.5cm (7.0cm) | inside 1.0cm (inside 5.0cm) | laminated | 0.95m × 9.40m | |
| eI, light b (east) | 1991-92 | internal | 7.5cm (7.0cm) | inside <0.5cm (inside <0.5cm) | laminated | 0.95m × 9.40m | |
| sXXII, light c (south) | 1991-92 | internal | 7.5cm (7.0cm) | inside 1.0cm (inside 5.0cm) | laminated | 1.15m × 7.50m | |
| sXXII, light a (south) | 1991-92 | internal (sensors) | 7.5cm (7.0cm) | inside <0.5cm (inside <0.5cm) | laminated | 1.15m × 7.50m | |
| nXXII, light a (north) | 1992-93 | internal | 7.5cm (7.0cm) | inside 1.0cm (inside 4.0cm) | laminated | 1.15m × 7.50m | |
| nXXII, light b (north) | 1992-93 | internal | 7.5cm (7.0cm) | inside <0.5cm (inside <0.5cm) | laminated | 1.15m × 7.50m | |
| nXXII, light d (north) | 1992-93 | internal | 7.5cm (7.0cm) | inside 1.0cm (inside 2.0cm) | laminated | 1.15m × 7.50m | |
| NXIII (north) | 1992-93 | internal | 6.0cm (5.5cm) | inside 1.0cm (inside 2.0cm) | laminated | 1.05m × 9.10m | |
| NV, light a (north) | 1992-93 | internal | 10.0cm (8.5cm) | inside 5.0cm (inside 5.0cm) | polycarbonate makrolon© | 1.25m × 12.50m | |
| NV, light c (north) | 1992-93 | external | 10.0cm (8.5cm) | outside 5.0cm (outside 5.0cm) | polycarbonate makrolon© | 1.25m × 12.50m |
Holy Cross, Keyenberg
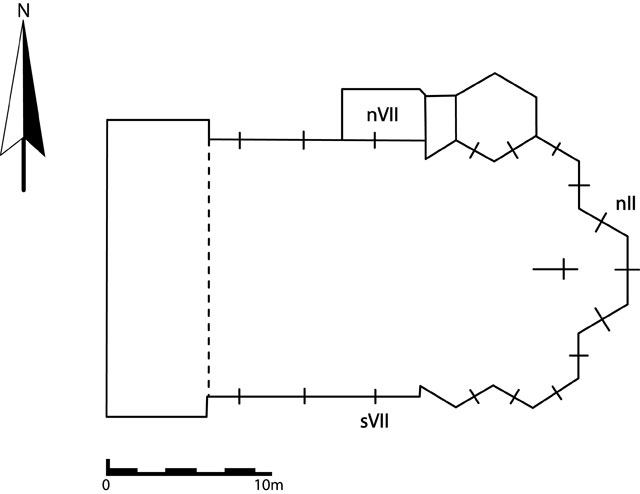
The small rural village of Keyenberg lies c.15km south of Mönchengladbach. The church was erected at the turn of the twentieth century, and is of a size common for village churches at that period. The church has been fitted with a circulating hot-air system, which in winter controls the climate inside automatically so that the temperature never sinks below 14°C. Before mass or any other event, the interior is heated to c.18°C. The church has stained glass from different periods: some glass originates from the turn of the twentieth century, some from the 1920s, and the rest was executed after 1950. None of the windows had protective glazing. The north-east window of the choir was used as a trial window. In addition, one north and one south window were fitted with different protective-glazing systems to carry out control measurements for the calculation models. Fig. 3 shows an outline ground-plan of the church, indicating the position of the windows surveyed.
-
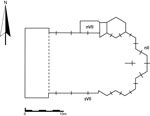
- Fig. 3. Keyenberg: outline ground-plan indicating the positions of the windows surveyed.
The North-East Window (nII)
The north-east window has three lights and overall measures approximately 1.55m x 4.50m. Each light measures approximately 0.45m x 3.65m, and two of the three lights were fitted with different types of protective glazing. During the first survey period, internally and externally ventilated systems were tested, and at the same time the results were compared with those from the glass in its original state in the light with no protective glazing. Common practice dictated the design of the glazing systems. The aim was to keep all particulars (such as the distance between the protective glazing and the original glass, and the size of the ventilation slits) pretty much the same, in order to render the comparisons more valid. The construction details of the different ventilation systems in the central and right-hand lights are as follows; the left-hand light was kept in its original state, in order to be able to assess the comparative effectiveness of the different protective-glazing systems.
The central light was fitted with an externally ventilated system. The protective glazing, made from sheets of 5mm-thick laminated glass, was fixed with purpose-made vanadium fittings on the outside to the existing T-shaped division bars. No additional sealant was used to plug the gap between the protective layer and the stone frame: the lead frames in which the protective glazing was set were fitted as closely as possible to the stone window frame, though of course not all gaps could be made airtight. The original glass remained in its original groove. The interspace between the two layers was 4cm, resulting in a gap of 2cm where the T-bars were set. The ventilation slits were designed to be located on the outside, at the head and foot of the light, and they measured c.1cm along the whole width of the light.
The right-hand light was fitted with an internally ventilated system. The original glass was removed, and the existing ironwork altered in order to accommodate both layers of glazing. The protective glazing was made from ordinary float glass, fitted into the original glazing grooves and pointed in. The original panels were fitted with brass frames that were U-shaped in section, then fixed to the inner edges of the window apertures 4cm into the interior of the church (thereby creating a gap of 2.5cm where there were elements of the support structure). No sealant was applied to seal the gap between the original glass and the stone window-frames: the brass-framed panels were simply fitted tightly to the masonry, making the creation of small gaps unavoidable. The ventilation slits were on the inside over the whole width of the light, and were 1.5cm wide at the foot of the light and 1cm wide at the head.
During the second survey period, the left-hand light (the one with glass in its original state) was fitted with a mixed-ventilation system. The original glazing was removed, and the ironwork altered; protective glazing made from float glass was fitted into the original glazing grooves and pointed in. Then the original leaded glass was framed with brass and set on the inside, in the same way as described for the internally ventilated system; the width of the interspace also corresponded to that of the internally ventilated system. Only the ventilation slits were altered: the one at the foot of the light was 2cm wide and open to the outside air, that at the head of the light was 1.5cm wide and open to the inside of the building.
The North Window and the South Window (nVII, sVII)
In order to verify the mathematical models, particularly detailed measurements were necessary. For this reason, two further windows of different orientation at Keyenberg church were fitted with protective glazing; one was located on the south side of the building, the other on the north side. Each of these three-light windows was fitted with an externally ventilated system as well as internally ventilated one, the central light in each case being left in its original state without protective glazing (fig. 4).
-
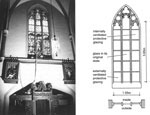
- Fig. 4. Keyenberg: the measuring equipment as installed, and diagrammatic view and horizontal section of the window.
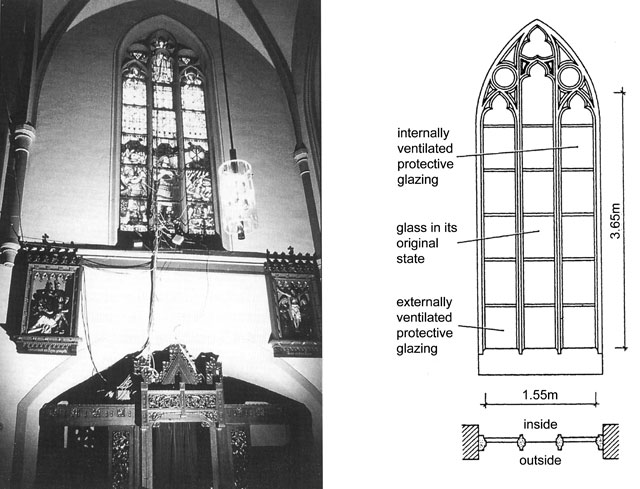
The design of the different ventilation systems for the north and the south windows was developed in line with the systems used previously, in order to be able to draw exact comparisons. Both windows are of similar size to the north-east window (1.55m x 4.55m overall), and each light measures approximately 0.45m x 3.65m. In principle, the construction systems were designed as has already been described for the internally ventilated system of the north-east window at Keyenberg.
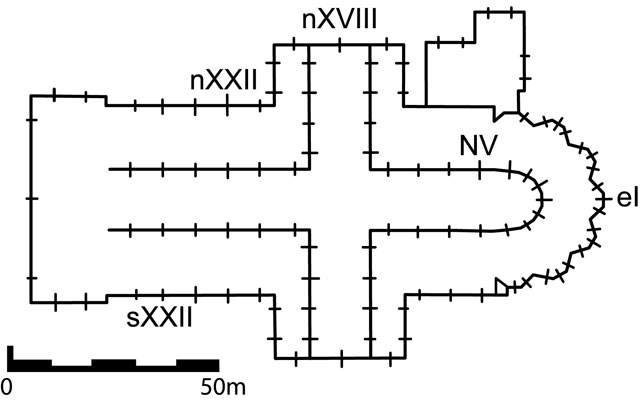
The Former Convent Church, Neuendorf
The small village of Kloster Neuendorf lies in the Altmark, c.30 km southwest of Stendal. The former Cistercian nunnery, where necessary cleaning and restoration work has not been undertaken in recent decades owing to financial difficulties, has medieval stained glass that is simply protected from accidental damage or vandalism by window grilles. As part of a research project organized by the Ministry for Research and Technology (the Bundesministerium für Forschung und Technologie), the stained glass was fitted with protective glazing in 1991. The installation of this protective glazing was able to take into consideration the results gained from the project up until that point. For the final part of the project, technical climatic measurements were carried out in relation to the different types of construction systems used for the protective glazing, to act as a control for the conclusions drawn; these measurements were taken during the third survey period.
The church has a rectangular ground plan (fig. 5). The inner walls are of non-plastered brickwork, and the church has no heating. Leaded glass (in the form of diamond quarry glazing in float glass) was used as the protective glazing for all eight windows with medieval stained glass. Because the windows were of different orientations and sizes, and because the way in which they are constructed at sill level differs in places, correspondingly different solutions were adopted. However, the general set-up and the way in which it was ventilated was the same everywhere, as follows. The medieval glazing was removed; the existing T-bars were altered to support both layers of glazing; the protective glazing was fitted into the original grooves and pointed in; and the original panels were mounted in brass frames that were U-shaped in section and set further into the interior. For technical reasons, the space between the protective layer and the original glass was set at 5.5cm, which resulted in an interspace of c.4cm where there were horizontal elements of the support structure. Lead flanges were soldered onto the vertical elements of the brass frame and pressed firmly onto the stonework. Internally ventilated systems were chosen for all windows, the size of the ventilation slits varying according to individual location. Measurements were taken at a north-facing window, an east-facing window, and two south-facing ones.
-
- Fig. 5. Kloster Neuendorf: outline ground-plan indicating the positions of the windows surveyed.

The North Window and the South Window in the Choir (nIV, sIV)
These two windows are situated opposite each other on the north and south sides of the choir. Both have two lights each, which are of roughly the same size. Overall the windows measure approximately 1.20m x 5.20m, with the individual lights measuring roughly 0.50m x 4.40m. The ventilation slits, which are open to the inside of the building, are of different sizes at the bottom and the top: at the heads of the lights they are c.2cm wide, and c.3cm at the foot, where the exchange of air is restricted by the presence of a condensation tray.
The East Window (eI)
The central window of the choir has three lights, and measures approximately 2.10m x 8.00m overall, the individual lights measuring roughly 0.60m x 6.20m. The ventilation slits at the top are 2cm wide, those at the bottom c.2.5cm. Here, there is no proper window sill, and therefore no condensation tray, and the bottom of the interspace is open to the interior without being obstructed by the stone framework.
The Window in the South Aisle (SII)
On the south side of the church a small window of two lights in the clerestory, on the same level as the organ gallery, was fitted with protective glazing. The window measures approximately 1.30m x2.50m, and the individual lights roughly 0.55m x1.75m. The ventilation slits at the top and bottom are roughly of the same size, c.1cm, across the width of the lights. Again it was necessary to introduce a condensation tray on the window sill, though the upturned edge of the tray was only c.1.5cm high, so did not constitute a notable obstruction to air exchange.
Cologne Cathedral
Cologne Cathedral lies in the heart of the city. There are many roads with heavy traffic nearby, and the main railway station to the north-east directly abuts the Cathedral precinct. The huge number of people passing through the unheated cathedral on a daily basis causes the relative humidity inside to increase, especially when the weather is damp or wet. All the historical stained glass in the Cathedral has been fitted with protective glazing, apart from the clerestory windows, for which protective glazing is being prepared. Because of the significance of Cologne Cathedral, surveys were undertaken at different windows (detailed in fig. 6) during the first three survey periods.
-

- Fig. 6. Cologne Cathedral: outline ground-plan indicating the positions of the windows surveyed.
The East Window (eI)
Surveys of the apse window in the choir were undertaken in the first and second survey periods, when the size of the interspace was altered. The medieval Bible window is oriented towards the east, measuring approximately 2.20m x 11m overall, with the individual lights measuring roughly 0.95m x9.40m. Protective glazing manufactured from laminated glass was fitted to each light, while the modern tracery was left in its original state, without protection. The system adopted was internally ventilated (isothermal glazing), and was installed as follows. The original glass was removed; the protective glass fixed into the original grooves and puttied in; on the inside a panel-mounting framework made of angle-irons was screwed to the stone framework the entire height of the lights (the framework was also supported at the bottom by the sill); the original panels were mounted in brass frames that were U-shaped in section and mounted on the framework, and the gaps between the panels were closed with strips that were Z-shaped in section. The interspace between the layers is c.7.5cm, at the T-bars is c.7cm.
Initially this system did not have any proper ventilation slits. Ventilation was achieved by the porosity of the masonry, as well as by very narrow gaps at the top and bottom of the lights, which were however less than 0.5cm wide. As the results of the first survey period were unsatisfactory (Oidtmann 1994; Oidtmann 1997), the ventilation slits were enlarged, at the heads of the lights to about 1cm, and at sill-level to c.5cm. During the second survey period, this set-up with wider ventilation slits was studied to establish whether the size of the ventilation slits had any effect on the results.
The Window in the South Aisle (sXXII)
The window in the south aisle has four lights and measures approximately 5.20m x 11m, with the individual lights measuring roughly 1.15m x 7.50m. The whole window was fitted with protective glazing manufactured from laminated glass. Outside trees give shade to the window. The protective-glazing system was similar to that used for the east window (eI), and again, the very small ventilation slits were enlarged for the second survey period.
The Window in the North Aisle (nXXII)
The north-facing window nXXII also has an internally ventilated protective-glazing system. During the third survey period, ventilation slits of three different sizes were introduced, in order to test one of the parameters (which were otherwise examined in a climate chamber under stationary conditions) under dynamic conditions. The window is of the same size as the one in the south aisle, measuring approximately 5.20m x 11m, the lights also being of the same size (1.15m x 7.50m). This internally ventilated system and the interspace are also the same as those at the east- and south-facing windows. The ventilation slits were sized as follows: light a - c.1cm at the head of the light, c.4cm at the foot; light b - <0.5cm at the head of the light, <0.5cm at the foot; light c - c.1cm at the head of the light, c.2cm at the foot.
The Window in the North Transept (NXIII)
During the third survey period, the six-light window in the northern transept was also the subject of a survey. The window measures approximately 7m x 13m overall, with the lights measuring roughly 1.05m x9.10m, and has internally ventilated protective glazing. The interspace between the glass layers is c.6cm, but at the T-bars it is only c.5.5cm. The ventilation slits at the heads of the lights are c.1cm wide, and at sill-level c.2cm wide.
A North Window in the Choir Clerestory (NV)
During the third survey period, measurements were taken at a clerestory window on the north side of the choir. The window measures approximately 5.70m x 17m, with the lights measuring roughly 1.25m x12.50m. Here an external protective-glazing system (see section 1.3) was installed, allowing the historic glass to remain in its original glazing grooves.
The protective glazing, made from polycarbonate (makrolon©), was clamped onto the old T-bars from the outside. The silicon framework (U-shaped in section) for the sheets of protective glazing ensured that the gap between the makrolon and the stonework was stopped up, and horizontal gaps between individual sheets were avoided by overlapping the panels. At 10cm, the interspace between the two layers of glass is relatively big; at the T-bars it is 8.5cm.
For this externally ventilated system, the lowest sheet of makrolon was shortened at the bottom in order to create a ventilation slit of c.5cm. For the internally ventilated system the sheets of polycarbonate glass were sealed with sheet lead at sill-level. The top and bottom panels of the original glass were removed, mounted in brass frames that were U-shaped in section, and set on supports towards the interior in such a way that ventilation slits of c.5cm were created at the top and bottom.
3. In Situ Survey of the Selected Windows
3.1. The Survey Programme and the Evaluation of its Results
The Survey Programme
In general, survey data were collected continually over a period of one year. The full range of values for the following physical quantities was measured and kept for evaluation later:
- air temperature and relative humidity on the inside of the building;
- air temperature and relative humidity in the interspace;
- air velocity in the interspace;
- surface temperatures of the protective glazing at different positions;
- surface temperatures of the original glass at different positions and on differently coloured pieces of glass.
In measuring the surface temperatures, values were not simply established for the protective glazing and the original glass: sensors were affixed to the glass in the upper, central and lower areas of the window; during the first survey they were also affixed to the glazing at the edges, near the masonry. These measurements were necessary in order to establish the full range of temperatures for one window. During the first two survey periods, differently coloured glasses were also examined in windows exposed to direct sunlight.
During the first and second survey periods (1990-91 and 1991-92), the following parameters were also studied:
- formation of condensation on the inside of the protective glazing;
- formation of condensation on the outside of the original glass;
- formation of condensation on the inside of the original glass.
Condensation was not measured during the third survey period (1992-93), as the equipment was clearly not always working correctly. Instead, the following parameters were examined in addition:
- air temperature and relative humidity outside;
- levels of sunlight in front of the protective glazing and behind the original glass.
The physical quantities described above were recorded as averages at intervals of six minutes during the first two survey periods; the measurement interval was increased to ten minutes during the third survey period.
Measuring Equipment
Different types of measuring equipment were used for the surveys, including sensors and data collectors (see the examples in fig. 7).
-

- Fig. 7. Keyenberg: measuring equipment and sensor.
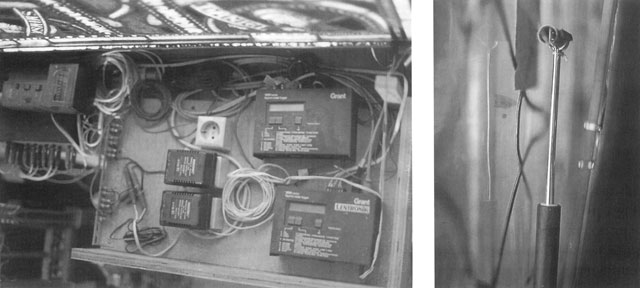
Surface temperatures were measured with Thermistor sensors, which can measure temperatures in the range from -50°C to +150°C. The sensors were fixed to the glass with microcrystalline wax. Because of the only negligible difference in temperature between the internal and external faces of the layers, temperatures were sometimes only measured on the inside, as the sensors were easier to fix there. Air temperatures and relative humidity were measured with Vaisala HMP 31 UT thermo-hygrometers. This sensor can measure temperatures in the range from -20°C to +80°C, and humidity from 0% to 100%. At the start of each survey period, the sensors were calibrated to the relevant data collecting equipment. The air velocity was measured with an Alnor GGA 26 thermo-anemometer. This particular piece of equipment is a hot-wire-anemometer, capable of measuring both air-current velocity and temperature; for air velocity the equipment can measure the range from 0.000m/s to 10.000m/s, and for temperature from -20°C to +80°C.
The thermo-hygrometer and thermo-anemometer were installed in a different way from the temperature sensors. Where the interspace was small or narrow, they were secured in place through the glass, held in containers made of synthetic material, a piece of the original glass having been exchanged for a piece of plain float glass into which a hole of suitable size had been drilled beforehand. However, if the interspace was large in comparison to the sensor, the latter was mounted in it with special brackets. In order to ensure that the values recorded were not misleading, the sensors were protected from direct sunlight with a covering.
A Kondens-Indikator was used to measure the levels condensation formed. This equipment works as follows: when condensation forms, the electrical conductivity of water causes two copper-foil sensors, fixed parallel and c.1cm apart onto the surface of the glass, to come into contact. This causes a change in the resistance in the Kondens-Indikator, which measures the humidity and converts it into voltage; this in turn effects a change in the voltage, which is recorded.
The equipment used for data storage were the 'squirrels' made by the firm Grant. At the time these surveys were undertaken, this kind of data logger was the most suitable for this type of measurement, because they have a huge storage capacity and can run on batteries or accumulators. Various types of 'squirrel' were used, as they proved to offer a variety of types of connection to other equipment.
Evaluation
The data collected from each survey site were processed with appropriate computer programmes and evaluated. In evaluating the completed results, discussion focused on the following key questions.
- Does the protective-glazing system installed offer the desired protection?
- Can the existing protective-glazing system be enhanced through simple structural alterations?
- Does the construction of the protective-glazing system need to be planned and executed afresh in any case?
- What kind of changes to the interior climate can be expected through the installation of a protective glazing system?
- What is the extent of the influence of factors such as heating systems, ventilation systems, the size of interspace, the size of the ventilation slits, and in particular condensation on the different surfaces of the glass on the performance of a protective-glazing system?
In order to be able to assess and to compare the data from different survey positions, it was necessary to find a standard criterion. Because the formation of condensation on the surfaces of the glass was considered to be of critical significance (and to be avoided if at all possible), frequency of possible occasions for condensation was chosen as the assessment criterion.
The Kondens-Indikator could not be relied on to measure the formation of condensation correctly (see above). For this reason, the cumulative frequency of relative humidity (that is, the frequency with which certain humidity levels occur during the cycle of a year) was calculated. The basis for these calculations were (for the formation of condensation on the interior face of the protective glazing for instance) the temperature of the protective glazing itself and the relative humidity in the interspace. Correspondingly, the frequency with which condensation formed on the interior face of the original glass was calculated from the temperature of the glass surface and the relative humidity of the interior of the building. The formula applied is well known from in situ analyses and can be found in the literature (Wit and Donze 1990; Oidtmann 1994). Data on the frequency with which condensation forms on glass surfaces often has very low values and may be difficult to read from the graphs that follow; for this reason they are also included in the appropriate tables.
The assessment of the data is divided into two parts. Firstly, the individual survey sites are considered, in order to examine and evaluate the performance of protective-glazing systems in relation to individual objects (Oidtmann 1994; Oidtmann 1997). Secondly, the survey sites are compared by means of selected criteria.
3.2. Results from Selected Survey Sites
Holy Cross, Keyenberg
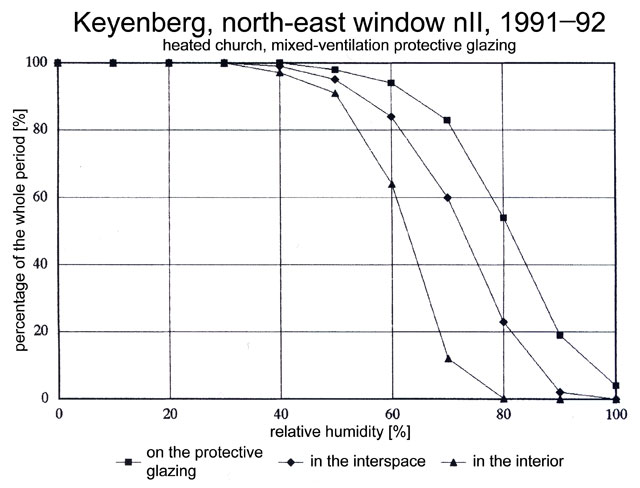
In the church at Keyenberg comparative measurements were taken from three adjacent lights in the north-east window in order to test different ventilation systems. During the first survey period (1990-91), lights with internally and externally ventilated systems were compared with one with glass in its original state (without protective glazing); during the second period (1991-92), the light with glass in its original state was fitted with a mixed-ventilated installation. Though the building is heated, the interior climate at Keyenberg conforms more to that of an unheated church than a heated one.
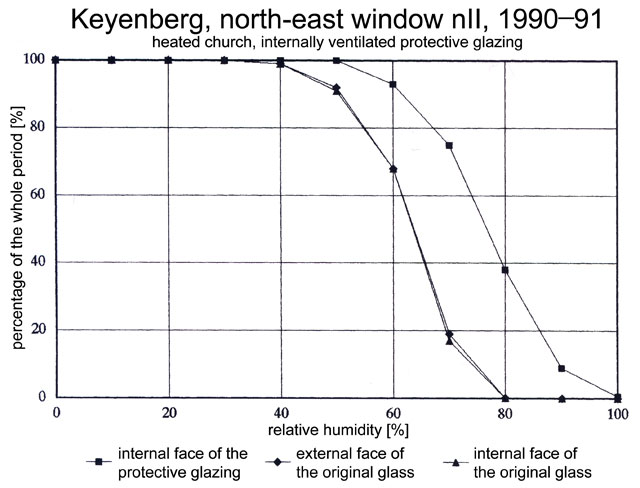
The internally ventilated system produced only a small level of condensation on the internal face of the protective glazing during both survey periods, and this is expressed numerically in table 3. The condensation factor given (0.5%) implies that condensation occurred for 0.5% of the time, approximately 44 hours during the course of one year. The internal face as well as the external face of the original glass remained dry (condensation factor 0%). Fig. 8 shows that the levels of humidity measured in the interior and interspace were lower than those measured on the inside face of the protective glazing. Fig. 9 shows the humidity values calculated for the three glass surfaces. The curves for the internal and external faces of the original glass are nearly identical and denote lower humidity values than those indicated by the curve for the internal face of the protective glazing. As mentioned above, the original glass remained dry, whereas condensation did occur briefly on the inside face of the protective glazing.
| Keyenberg, Holy Cross: North-east Window | 1990-91 Internal ventilation | 1990-91 External ventilation | 1990-91 Original state | 1991-92 Internal ventilation | 1991-92 External ventilation | 1991-92 Mixed ventilation |
|---|---|---|---|---|---|---|
| Relative humidity* in the interspace | 68% | 69% | - | 67% | 71% | 71% |
| Relative humidity* in the interior | 64% | 64% | 64 % | 61% | 61% | 61% |
| Formation of condensation (% of total time) on the inside of the protective glazing | 0.5% | 0% | - | 0.01% | 0% | 4% |
| Formation of condensation (% of total time) on the outside of the original glass | 0% | 0.01% | 0% | 0% | 0% | 0% |
| Formation of condensation (% of total time) on the inside of the original glass | 0% | 0.01% | 0% | 0% | 0.01% | 0% |
| Air temperature* in the interspace | 13°C | 12°C | - | 14°C | 13°C | 14°C |
| Air temperature* in the interior | 14°C | 14°C | 14°C | 15°C | 15°C | 15°C |
| Surface temperature of the protective glazing* | 13°C | 12°C | - | 14°C | 12°C | 13°C |
| Surface temperature of the protective glazing* minimum | -4°C | -8°C | - | 0°C | -3°C | -2°C |
| Surface temperature of the protective glazing* maximum | 31°C | 32°C | - | 30°C | 31°C | 31°C |
| Surface temperature of the original glass* | 15°C | 14°C | 15°C | 16°C | 14°C | 15°C |
| Surface temperature of the original glass* minimum | 5°C | -5°C | -1°C | 6°C | 0°C | 4°C |
| Surface temperature of the original glass* maximum | 30°C | 30°C | 30°C | 27°C | 29°C | 28°C |
| Air velocity in the interspace* | 0.14 m / s | 0.14 m / s | - | 0.20 m / s | 0.20 m / s | 0.23 m / s |
| Air velocity in the interspace* maximum | 0.35 m / s | 1.13 m / s | - | 0.43 m / s | 0.63 m / s | 0.83 m / s |
*average annual value
-

- Fig. 9. Keyenberg: cumulative frequency of the relative humidity for different glass surfaces with an internally ventilated system.
During the second survey period, the internally and externally ventilated systems produced less condensation. By comparing the data sets in table 3, it can be seen that during this survey period the air velocity in the interspace was on average c.40% higher than during the previous year. As the installation was not altered, the increase of 1°C in the temperature in the interior during the middle of the year must clearly be responsible for this.
With the externally ventilated system very small amounts of condensation formed during both survey periods; there was no condensation on the protective glazing. However, during the first survey period it did occur on the internal and external faces of the original glass, whereas during the second survey period it occurred only on the internal face of the original glass (table 3). During the second survey period, this resulted from increased air velocity in the interspace of the externally ventilated system, which allowed the surfaces of the glass to dry more quickly. The highest levels of condensation noted were for the mixed-ventilation system, but only on the internal face of the protective glazing (table 3 and fig. 10).
-

- Fig. 10. Keyenberg: cumulative frequency of the relative humidity with a mixed-ventilation system.
The glass in its original state (with no protective glazing) was the only survey object at this location not to produce any condensation at all. It also became clear that the internally ventilated system subjected the original glass to smaller fluctuations in temperature than the externally ventilated one.
It is clear from the comparative measurements that the protection of stained glass could only be achieved with an internally ventilated protective-glazing system. The externally ventilated system did produce less condensation, but the condensation occurred on the original glass, which should in fact be protected from moisture. Historical glass can be protected more effectively if the internal climate of the church is stabilized, for example, by informed management of a heating system.
Convent Church, Kloster Neuendorf
The figures in table 4 demonstrate that the internal climate of this unheated church was very damp. The annual average relative humidity was approximately 10-12% higher than that in the unheated churches in Cologne and Altenberg. The relative humidity in the interspace of the four windows with internally ventilated protective-glazing systems is lower on average than that in the church. The high humidity on top of the very low outside temperatures resulted in a condensation factor of 14% on the inside face of the protective glazing, depending on the orientation of the window. The small south window showed the best result, with a condensation factor of only 7% (fig. 11 and table 4). However, the formation of condensation was not detected on of the original glass. If we consider air velocity in the interspace, it becomes apparent that the values for the north and south windows were relatively low. This can be attributed to the small fluctuations in temperature between the internal space and interspace, and also to the introduction of ventilation slits.
| Kloster Neuendorf Convent Church | North window | East window | South window | Small south window |
|---|---|---|---|---|
| Relative humidity* in the interspace | 73% | 72% | 70% | 69% |
| Relative humidity* in the interior | 76% | 76% | 76% | 76% |
| Formation of condensation (% of total time) on the inside of the protective glazing | 14% | 14% | 12% | 7% |
| Formation of condensation (% of total time) on the outside of the original glass | 0% | 0% | 0% | 0% |
| Formation of condensation (% of total time) on the inside of the original glass | 0% | 0% | 0% | 0% |
| Air temperature* in the interspace | 11°C | 11°C | 12°C | 12°C |
| Air temperature* in the interior | 11°C | 11°C | 11°C | 11°C |
| Surface temperature of the protective glazing* | 10°C | 10°C | 11°C | 12°C |
| Surface temperature of the protective glazing* minimum | -14°C | -13°C | -13°C | -12°C |
| Surface temperature of the protective glazing* maximum | 29°C | 40°C | 41°C | 44°C |
| Surface temperature of the original glass* | 11°C | 11°C | 12°C | 12°C |
| Surface temperature of the original glass* minimum | -9°C | -9°C | -8°C | -8°C |
| Surface temperature of the original glass* maximum | 28°C | 43°C | 42°C | 41°C |
| Air velocity in the interspace* | 0.12 m / s | 0.22 m / s | 0.12 m / s | 0.13 m / s |
| Air velocity in the interspace* maximum | 0.34 m / s | 0.67 m / s | 0.39 m / s | 0.29 m / s |
*average annual value
-
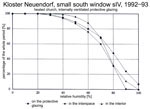
- Fig. 11. Kloster Neuendorf: cumulative frequency of the relative humidity.
Judging from the results of this survey, we had to conclude that the internally ventilated protective-glazing system did not offer the desired protection. However, the reasons for this lay with the climate situation inside the church, not with the system itself. To enhance the performance of this protective-glazing system, a properly functioning heating system would need to be installed in order to alter the climatic conditions inside the church. It is also possible that reviewing the size of the ventilation slits and enlarging them could slightly enhance the effectiveness of this system.
Cologne Cathedral
Extensive measurements were taken in Cologne Cathedral at different windows during the three survey periods. The results are set out in tables 5-7.
| Cologne Cathedral | 1990-91 North window (eI) | 1991-92 East window (eI) | 1991-92 South window (sXXII) |
|---|---|---|---|
| Relative humidity* in the interspace | 72% | 73% | 68% |
| Relative humidity* in the interior | 66% | 67% | 67% |
| Formation of condensation (% of total time)on the inside of the protective glazing | 12% | 4% | 0.5% |
| Formation of condensation (% of total time) on the outside of the original glass | 0% | 0% | 0% |
| Formation of condensation (% of total time) on the inside of the original glass | 0% | 0% | 0% |
| Air temperature* in the interspace | 12°C | 13°C | 13°C |
| Air temperature* in the interior | 13°C | 13°C | 13°C |
| Surface temperature of the protective glazing* | 12°C | 13°C | 13°C |
| Surface temperature of the protective glazing* minimum | -10°C | -3°C | 0°C |
| Surface temperature of the protective glazing* maximum | 46°C | 42°C | 42°C |
| Surface temperature of the original glass* | 14°C | 14°C | 14°C |
| Surface temperature of the original glass* minimum | -4°C | 4°C | 2°C |
| Surface temperature of the original glass* maximum | 51°C | 46°C | 42°C |
| Air velocity in the interspace* | 0.11 m / s | 0.22 m / s | 0.26 m / s |
| Air velocity in the interspace* maximum | 0.29 m / s | 0.94 m / s | 0.96 m / s |
*average annual value
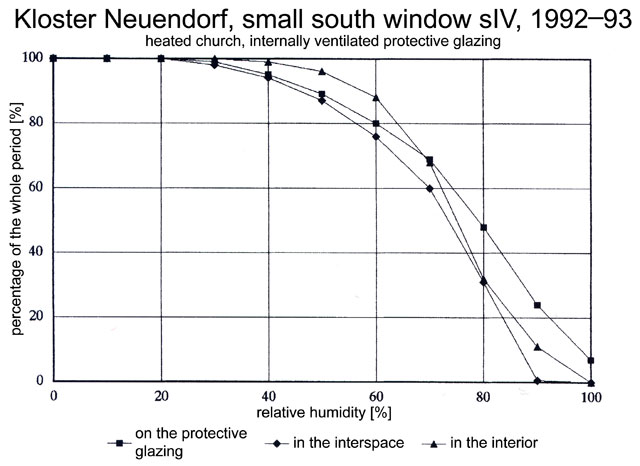
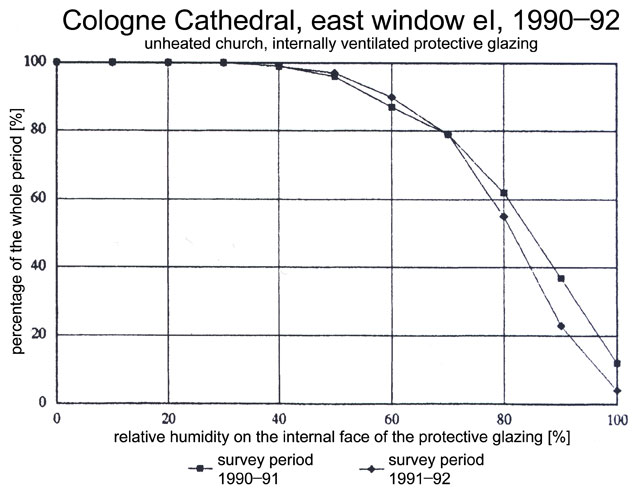
The results from the internally ventilated east window proved unsatisfactory after the first survey period (fig. 12 and table 5), as there was a condensation factor of 12% for the internal face of the protective glazing. Low air velocity in the interspace pointed to the fact that the air exchange was not happening as desired, which was understandable considering the size of the ventilation slits (<0.5cm). As a result, the ventilation slits were enlarged to c.5cm in the lower area, and to c.1cm in the upper area. A comparison of the two surveys shows clearly that this measure improved the effectiveness of the protective glazing on the east window. The condensation factor was reduced from 12% to 4%. Further enlargement of the ventilation slit in the upper zone, where air enters the interspace, should enhance the performance of the protective glazing.
-

- Fig. 12. Cologne Cathedral, east window: comparison of the cumulative frequencies of relative humidity on the internal face of the protective glazing for the survey periods 1990-91 and 1991-92.
As far as the in situ survey was concerned, the measurements taken during the second survey period at the south window sXXII (with its internally ventilated protective-glazing system with large ventilation slits) can also be considered to have brought positive results, because of the very low condensation factor (0.5%, see table 5). A comparison with the results from first survey period, where the ventilation slits here were as small as those of the east window, cannot be made, as the equipment at this survey position very often failed.
| Cologne Cathedral North window (nXXII) | Ventilation gap of c.4cm | Ventilation gap of c.2cm | Ventilation gap of <0.5cm |
|---|---|---|---|
| Relative humidity* in the interspace | 68% | 68% | 69% |
| Relative humidity* in the interior | 64% | 64% | 64% |
| Formation of condensation (% of total time)on the inside of the protective glazing | 3% | 4% | 7% |
| Formation of condensation (% of total time) on the outside of the original glass | 0% | 0% | 0% |
| Formation of condensation (% of total time) on the inside of the original glass | 0% | 0% | 0% |
| Air temperature* in the interspace | 12°C | 12°C | 12°C |
| Air temperature* in the interior | 11°C | 11°C | 11°C |
| Surface temperature of the protective glazing* | 10°C | 11°C | 12°C |
| Surface temperature of the protective glazing* minimum | -13°C | -13°C | -12°C |
| Surface temperature of the protective glazing* maximum | 40°C | 42°C | 44°C |
| Surface temperature of the original glass* | 11°C | 12°C | 12°C |
| Surface temperature of the original glass* minimum | -9°C | -8°C | -8°C |
| Surface temperature of the original glass* maximum | 43°C | 42°C | 41°C |
| Air velocity in the interspace* | 0.28 m / s | 0.19 m / s | 0.16 m / s |
| Air velocity in the interspace* maximum | 0.59 m / s | 0.41 m / s | 0.31 m / s |
*average annual value
The comparative measurements for the north window nXXII set out in table 6 show clearly that the size of the ventilation slits has a decisive impact on the formation of condensation here (see section 3.3).
The results from the different ventilation systems fitted to the north choir window NV indicated that the internally ventilated protective glazing performs somewhat worse from a climatic point of view, as it evidenced by the condensation factor (1%) for the internal face of the protective glazing (fig. 13 and table 7). The externally ventilated system did not produce condensation (fig. 14 and table 7), and no condensation formed on the original glass with either system. The results from the internally ventilated system for the north transept window NXIII correspond in general with those from the internally ventilated system at the north choir window NV.
| Cologne Cathedral | North choir window with internal ventilation | North choir window with external ventilation | North transept window with internal ventilation |
|---|---|---|---|
| Relative humidity* in the interspace | 68% | 65% | 69% |
| Relative humidity* in the interior | 63% | 63% | 63% |
| Formation of condensation (% of total time) on the inside of the protective glazing | 1% | 0% | 2% |
| Formation of condensation (% of total time) on the outside of the original glass | 0% | 0% | 0% |
| Formation of condensation (% of total time) on the inside of the original glass | 0% | 0% | 0% |
| Air temperature* in the interspace | 12°C | 12°C | 12°C |
| Air temperature* in the interior | 12°C | 12°C | 12°C |
| Surface temperature of the protective glazing* | 10°C | 11°C | 11°C |
| Surface temperature of the protective glazing* minimum | -4°C | -6°C | -1°C |
| Surface temperature of the protective glazing* maximum | 29°C | 29°C | 29°C |
| Surface temperature of the original glass* | 11°C | 13°C | 12°C |
| Surface temperature of the original glass* minimum | 0°C | -2°C | -1°C |
| Surface temperature of the original glass* maximum | 27°C | 28°C | 29°C |
| Air velocity in the interspace* | 0.14 m / s | 0.16 m / s | 0.20 m / s |
| Air velocity in the interspace* maximum | 0.56 m / s | 0.60 m / s | 0.40 m / s |
*average annual value
3.3. Comparison of Different Aspects of the Survey Sites
Heating of the Church
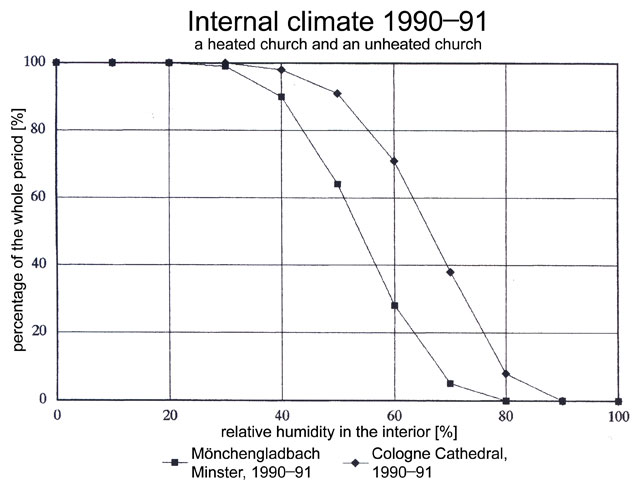
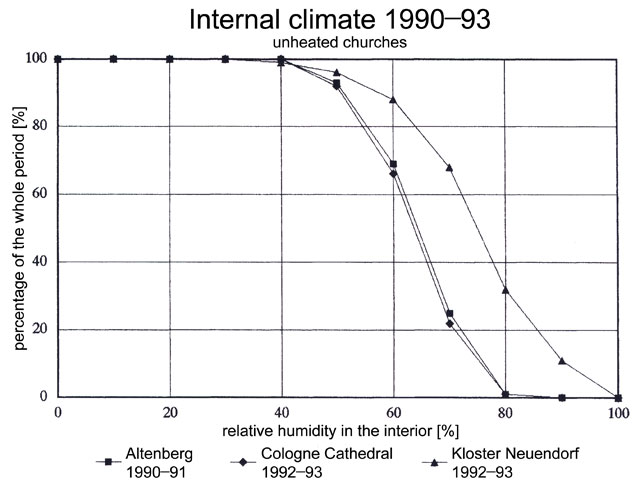
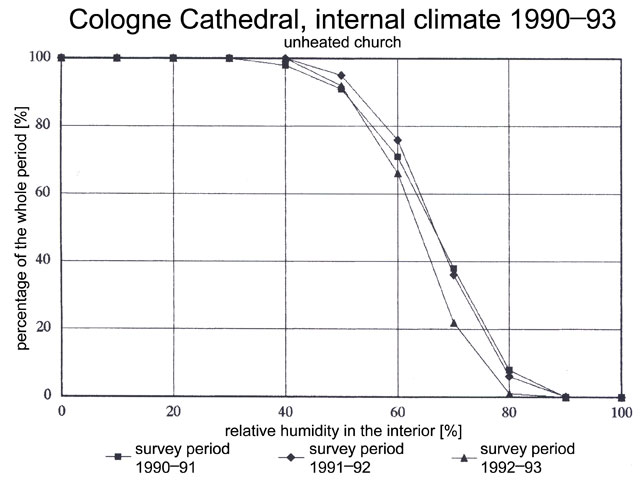
It was clear from the surveys that the climatic conditions inside individual churches varied greatly. Not only can great differences be found between heated and unheated churches (fig. 15), but also between the heated churches; the same is true for unheated churches (fig. 16). Moreover, the internal climate may vary from year to year, as the results of Cologne Cathedral, where data were gathered over three survey periods, demonstrate (fig. 17). It should also be noted that the relative humidity of the interior is dictated by the following parameters:
- average air temperature of the interior;
- exterior humidity and exchange of air with the outside;
- sources of moisture in the interior;
- interchange of moisture with interior walls.
-

- Fig. 15. Comparison between the cumulative frequencies of relative humidity in the interiors of a heated and an unheated church.
-

- Fig. 16. Comparison between the cumulative frequencies of relative humidity in the interiors of three heated churches.
-

- Fig. 17. Comparison between the cumulative frequencies of relative humidity in the interior of an unheated church over a period of three years.
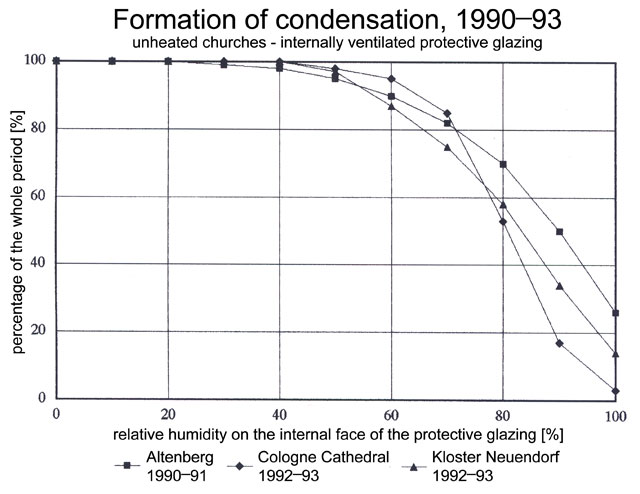
With internally ventilated systems condensation on the glass surface is determined by the relative humidity in the inside of the building as well as the relative humidity in the interspace. A damp internal climate however does not necessarily mean increased frequency of moisture on the surface of the glass. Fig. 18 shows the frequency with which moisture occurs on the inside face of the protective glazing at the north and east windows of three unheated churches (see also fig. 16). Although the internal climate of the cathedrals at Cologne and Altenberg differs only marginally, the frequencies with which moisture occurs on the protective glass differ considerably; for the whole survey period Cologne had a condensation factor of over 3%, but Altenberg one of more than 26% during the same survey period! At Kloster Neuendorf the internal climate registered as being extremely damp, yet the frequency with which condensation formed on the protective glazing was between that of Cologne and Altenberg: 14% of the time over the whole period. Generally, it may be said that the possibility of condensation forming is lower in a heated church than in an unheated one, as the relative-humidity value is usually lower.
-

- Fig. 18. Comparison between the cumulative frequencies of relative humidity on protective glazing in unheated churches.
Ventilation Systems
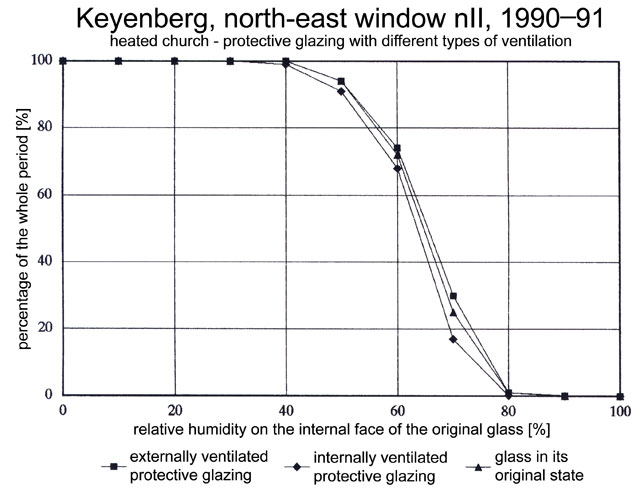
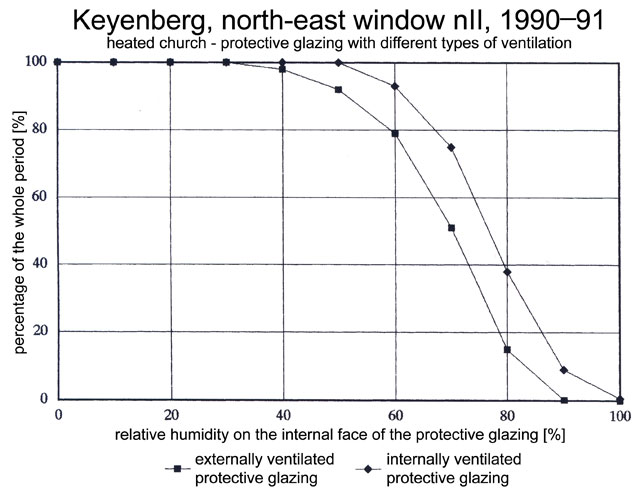
During the first survey period, the results from lights in one window in the heated church at Keyenberg fitted with internally and externally ventilated systems were compared with those from the glass in the same window left in its original state (with no protective glazing). In order to study the relative effectiveness of the different systems more closely, the cumulative frequency of relative humidity was measured on the internal face of the protective glazing as well as on the internal and external faces of the original glass. Fig. 19 gives the data for the protective glazing, and it is evident that the protective glazing was always damper with the internally ventilated system than with the externally ventilated one; moreover, the condensation factor was 0.5%.
-

- Fig. 19. Comparison between the cumulative frequencies of relative humidity on the internal face of the original glass with different ventilation systems.
If we compare moisture levels on the external face of the original glass under the different systems, we see that with the internally ventilated system the relative humidity does not exceed 80%, whereas with the externally ventilated system, condensation formed for a brief period.
Fig. 20 shows the relative humidity on the internal face of the original glass; data from the glass in its original condition is also included for comparison. The internally ventilated system gives the most satisfactory results. Again, the externally ventilated system had a brief period of condensation (with a factor of 0.01%, see table 3). Values for the glass in its original state lie between those for the internally and externally ventilated systems.
-

- Fig. 20. Comparison between the cumulative frequencies of relative humidity on the internal face of the protective glazing with different ventilation systems.
During the second survey period, comparative measurements were again taken at Keyenberg, and the glass that was not originally protected was fitted with a mixed-ventilation system. Principally, the data received from the internally and externally ventilated systems was comparable to that of the previous year, whereas the mixed-ventilation system produced results worse than those for the internally ventilated system.
In conclusion it can be said that the danger of condensation forming on the protective glazing is lowest with externally ventilated systems. However, the formation of condensation on the original glass, even if only for a short period, should be thought a severe disadvantage. With all other systems, condensation formed on the internal face of the protective glazing, but the original glass remained dry. Internally ventilated system therefore gave the best results.
Window Orientation
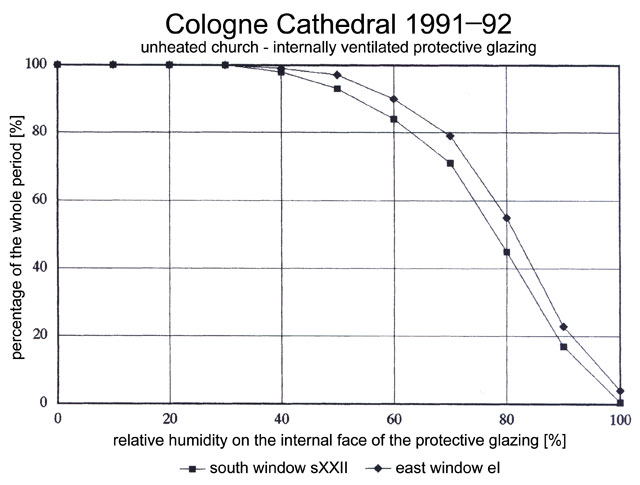
During the four survey periods, differently oriented windows with protective glazing were surveyed; these were mainly east-, north-, north-east-, and south-facing windows, with only one south-west-facing one. During the second survey period, parallel measurements were carried out at a south-facing and an east-facing window in Cologne Cathedral in order to examine the influence of the window location in detail. Fig. 21 shows the cumulative moisture frequencies on the internal face of the protective glazing in Cologne Cathedral, and clearly shows how the curves run almost parallel, with the south window displaying lower moisture levels.
-
- Fig. 21. Comparison between the cumulative frequencies of relative humidity on the internal faces of protective-glazing systems with different orientations in Cologne Cathedral.
During the third survey period, measurements were carried out simultaneously at four windows with three different orientations at Kloster Neuendorf. These were a north and a south window of similar size, a slightly larger east window, and a very small south window. Again, the curves for moisture frequency run similar, nearly parallel courses.
Comparative measurements were also carried out in other churches. At Erfurt Cathedral a south window and a north window were examined, and in the Gotisches Haus at Wörlitz an east and a south window were compared. The outcome was virtually identical with the results outlined above. The results of these surveys show that all window orientations have the potential for condensation, but south windows have a lower risk than north and east windows; relative moisture levels decrease for south-facing windows on account of the sunlight shining through them.
In conclusion it may be said that the orientation of a window does have an effect on the formation of condensation. However, there is a direct connection to the interior climate of the building. North windows of unheated churches suffer more frequently from condensation on the surface of the glass. Generally, windows of other orientations also do better in heated churches, as the possibility for condensation to form is reduced.
Ventilation of the Interspace
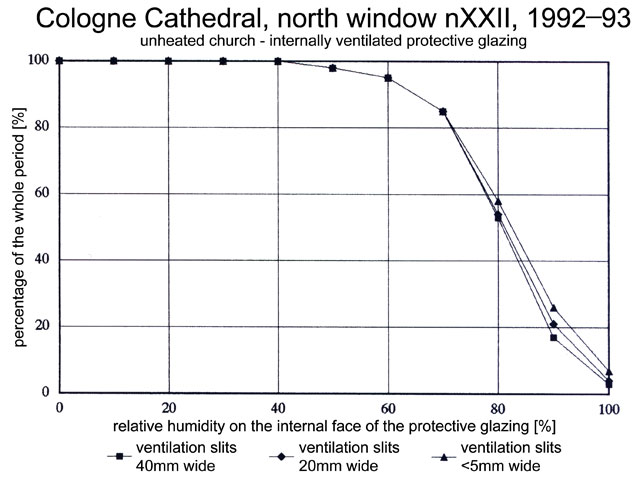
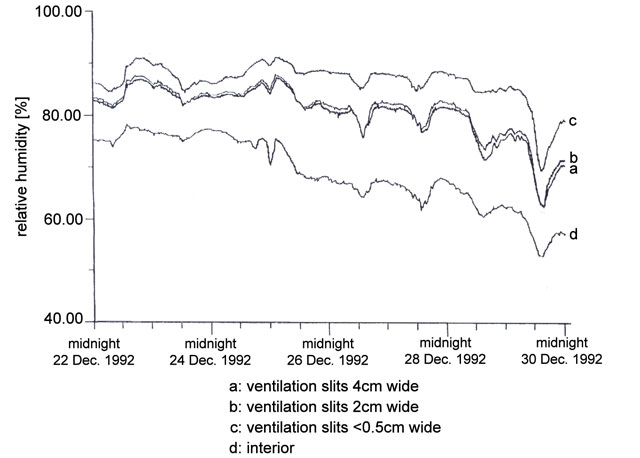
As already mentioned in the first section on survey sites, ventilation slits have a great influence on the effectiveness of the protective glazing. The results of the comparative measurements taken in relation to the size of ventilation slits at the north window nXXII at Cologne Cathedral (with an internally ventilated protective-glazing system), show that larger ventilation slits reduce the possibility of condensation forming on the internal face of the protective glazing (see table 6 and fig. 22).
-

- Fig. 22. Cumulative frequency of relative humidity for different sizes of ventilation gap with internally ventilated systems.
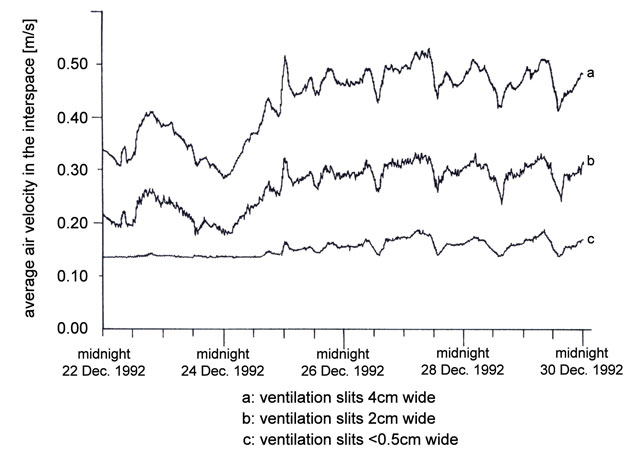
In general, enlarging ventilation slits increased air velocity (fig. 23). This in turn produces a better exchange of air between the interior of the building and the interspace, leading to lower relative humidity in the interspace (fig. 24). Similar experiments aimed at improving the climate in the interspace were also conducted during the first survey period at the north-east window in Marburg, as well as during the second survey period at the east window of Cologne Cathedral.
-
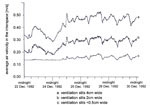
- Fig. 23. Air velocity in the interspace with ventilation gaps of different sizes.
-
- Fig. 24. Relative humidity in the interior of the church and in the interspace with ventilation gaps of different sizes.
Heating the Interspace
During the fourth survey period, the effectiveness of heating the interspace was tested. At Augsburg Cathedral two windows of the same orientation with internally ventilated protective-glazing systems, one with heating, the other without, were compared. Fig. 25 shows the values for the cumulative frequency of relative humidity on the internal face of the protective glazing.
-

- Fig. 25. Cumulative frequency of the relative humidity on the internal face of the protective glazing with a heated interspace.
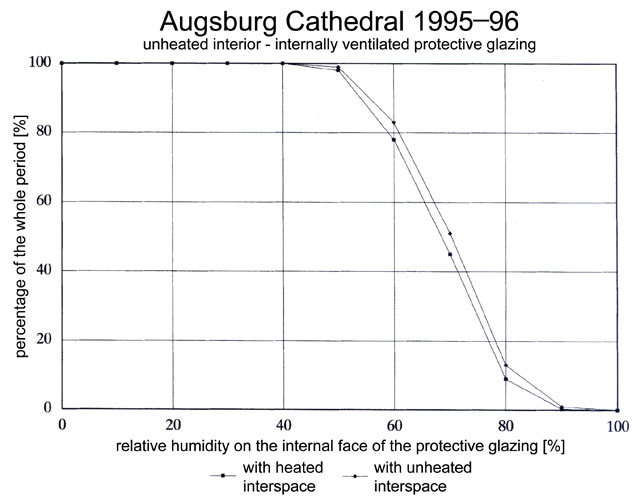
The results of this research showed that the system with a heated interspace had slightly lower levels of moisture, thereby reducing the risk of condensation forming. However, whether general conclusions can be drawn from these results is not clear.
Assessment of the Survey Data
If all the survey sites are compared with one another, it may be observed that the difference between the average annual relative humidity in the interspace and in the inside of the building lies between 1% and 14%. Although at Kloster Neuendorf the relative humidity in the interspace was lower than that inside of the building, the reverse was true at all other sites, whether heated or unheated. It was established that there was always the possibility of condensation forming on the internal face of the protective glazing of internally ventilated glazing systems in unheated churches. In heated churches, condensation formed, but to a much lesser extent. No condensation was found on the original glass with internally ventilated installations; conversely there was a possibility - albeit a small one -of condensation forming on both faces of the original glass with the externally ventilated system at Keyenberg.
It could be seen from the measurements that condensation forms with internally ventilated systems every time the relative humidity in the interspace exceeded the annual average of 68%. Even below this threshold there was the possibility of condensation forming, but much reduced (a condensation factor of less than 1%). The mixed-ventilation systems behaved in a similar manner, though the smaller number of survey sites with this type of system does not permit general conclusions to be drawn. The only non-ventilated system (the church at Breinig, see Oidtmann 1997) displayed high levels of condensation despite a low rate of relative humidity in the interspace.
The heating of the interspace at one window in Augsburg Cathedral produced satisfactory results on the whole. However, this was a single case, and general conclusions should not be drawn.
The air temperature in the interspace is subject to greater fluctuations than that of the interior of the building. The differences in annual averages lie between 0°C and 3°C, with the summer differences smaller than the winter ones. The average annual values for the temperature of the interior and interspace in the various churches lay between 11°C and 17°C, the higher temperatures being recorded in the heated churches.
The difference between the annual average surface temperature of the protective glazing and that of the original glass also lay in the range from 0°C to 3°C. The surveys showed a clear drop in temperature from the top to the bottom of the windows, and from the centre to the sides of the windows. The average annual temperatures of the protective glazing reached temperatures between 10°C and 16°C, those of the original glass between 11°C and 18°C.
The lowest temperatures for the protective glazing were recorded in Wörlitz (-16°C), Kloster Neuendorf (-14°C), and Cologne and Erfurt (-13°C); the lowest temperatures for the original glass were found in Wörlitz (-12°C), and Cologne, Erfurt and Neuendorf (-9°C). The highest temperatures for protective glazing were measured at the south windows at Wörlitz (52°C), in Rheydt-Giesenkirchen (53°C), and on east windows in Mönchengladbach (50°C). The highest temperatures for the original glass were recorded in Wörlitz (55°C) and Cologne (51°C). Apart from Erfurt, where a north window reached temperatures up to 31°C, the north windows generally did not exceed temperatures of 30°C. The differences between the temperatures of the interiors of the buildings and the surface temperatures of the original glass were generally only 1°C; sometimes they were equal. The greatest air velocities in the interspace were measured at the mixed-ventilation system in Mönchengladbach Minster (1.76m/s), at the internally ventilated system on the south window at Erfurt Cathedral (1.36m/s), and at the externally ventilated system at Keyenberg (1.13m/s).
The average annual data for air velocity in the interspace varied and lay between 0.11m/s and 0.34m/s. With internally ventilated systems, the level of air velocity influenced the air exchange between the interior of the building and the interspace, as can be seen clearly from the different relative-humidity values.
Taking all survey sites into account, it became clear that the effectiveness of a protective-glazing system does not only depend on the system itself, but also on the interior climate of the church.
3.4. Further Research
As preparation for the in situ measurements taken inside the churches, research was conducted in a climate chamber, the so-called 'hot box', at the Technical University in Eindhoven. The first trial measurements served mainly to test the appliances chosen and the way in which the programme of measurements had been set up, before the real measurements were taken inside the churches. Later measurements inside the hot box were used to check the computer models that had been developed, and to compare the different parameters.
The Hot-Box Measurement Programme
The 'hot box/cold box' is a set-up for taking measurements under laboratory conditions and consisting of a warm-climate chamber and a cold-climate chamber, between which a test wall can be erected (fig. 26). Inside the warm-climate chamber an unchanging climate of a church warmed to 16°C with a static humidity level of 60% was simulated. Inside the cold-climate chamber an unchanging outside climate was simulated; the 'outside' temperatures were varied in a series of tests in order to establish the threshold at which condensation formed for the different systems. The test wall consisted of a frame in sandstone, the profile of which imitated that of the type of window frames found in churches of all periods. The test window was built into a partition of calcium-silicate bricks that was plastered over with a gypsum-based plaster.
-
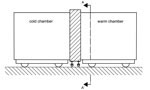
- Fig. 26. Side-view of the 'hot-box/cold-box'.

In order to test different systems simultaneously under the same conditions, the test wall was divided into three lancets, each c.1.10m high and c.0.5m wide. The individual lancets were also divided by horizontal T-bars into three sections in order to mirror the structure of a historical window (fig. 27). During the different measurements taken in the hot box, certain elements (such as type of ventilation, size of ventilation slit, as well as the material used for the protective glazing) had to be altered, in order to match the measurement set-up of the planned surveys.
-
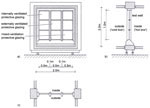
- Fig. 27. View and horizontal cross-section of the test wall: (1) vertical section A-A', (2) vertical section, (3) horizontal section.
When looking at the results of these measurements, taken under laboratory conditions, one has to bear in mind that the tests were carried out under static conditions, and that the dimensions of the protective-glazing systems were restricted by the size if the climate chamber. Both the measurements taken in the climate chamber and those taken under real conditions showed that with all systems the size of the ventilation slits had a decisive influence on the air velocity in the interspace. The laboratory studies made it clear that for a particular window height, there are an optimal depth for the interspace and optimal dimensions for the ventilation slits resulting in an optimal exchange of air. In this scenario, the relationship of depth of the interspace to the height of the window is particularly important: if the interspace is too deep, the protective layer ceases to act as an enclosing layer, which means that eddies of air can occur in the interspace. The studies conducted in the laboratory showed that the narrower dimension of the ventilation slits should be at least as large as the depth of the interspace. However, for technical and aesthetic reasons, this would rarely be possible to achieve in churches.
Differences of air temperature between internal and external air also influenced the air velocity level. With internally ventilated systems, air velocity determines the rate of air exchange between the inside of the building and the interspace, from which it may be deduced that there is a direct relationship between the climates inside a building and in the interspace.
The Computer Model
In order not to have to conduct costly and complicated tests at every survey site, a computer model called 'THChurch' was developed. This model is able to simulate the changing temperature and moisture conditions in a church, and assertions can therefore be made on changes of climate inside a building, as well as when and for how long condensation may form on windows. For calculation purposes, the following factors, all of them influenced by the relative humidity inside the church, were considered important: the absorption factor of leaded glass, the temperature of the glass and that of the air behind it; the hygroscopic behaviour of the materials under consideration; any heating system; and the level of ventilation in the church. The calculation models were checked against experiments conducted in the climate chamber at the Technical University of Eindhoven, and against in situ measurements taken for different protective-glazing systems.
Overall, it did prove possible to simulate internal climate and its effects on windows with the computer model THChurch. The quality of the calculations and (therefore) the results depends to a great extent, however, on the preciseness of the input data. This means that before starting calculations, the interior space of a church must be carefully analyzed, an analysis that should include data concerning visitor numbers and central heating.
4. Glass-Sensor Studies on the Selected Windows
4.1. The Glass-Sensor Method
A new method for monitoring the impact of complex environmental conditions, known as the glass-sensor method, was developed at the Fraunhofer-Institut für Silicatforschung (Fraunhofer Institute for Silicate Research, ISC) in Würzburg between 1986 and 1988 (Fuchs, Patzelt, Tünker and Schmidt 1988; Fuchs, Römich and Schmidt 1991). The procedure has been patented (Fuchs, Patzelt and Tünker 1989) and standardized (VDI Richtlinie 3955, Blatt 2). The method consists in using sensitive simulation materials (model glasses), which are subjected to various corrosive processes (the exact process depending on the corrosive conditions specific to a locality); these processes match phenomenologically the types of damage known to occur to historical glass. Because glass surface conditions can be reproduced on the model glasses, the exact degree of corrosion can be determined, when the glass has been suitable prepared, by analysis of the hydroxyl group absorption band using infra-red spectroscopy.
With model glasses, unlike historical types of glass, it is possible to accelerate the corrosive processes by appropriate modification of the sensors' chemical composition, and results for developments over long periods of time and under specific environmental conditions that could be achieved with original glass only over decades can in fact be achieved in a matter of months. The sensitivity the sensors and their placement is determined by the composition of the glass. For this study, the main glass sensor used was type MI. The evaluation of results from glass sensors was conducted primarily by means of microscopic and infra-red spectroscopic analysis.
Infra-red Spectroscopy
The phenomenon of corrosion on the sensor surfaces can be assessed quantitatively by measuring valency oscillation - one of the types of oscillation that can occur when a substance is subjected to infra-red radiation - of the hydroxyl group. Furthermore, because the hydroxyl group absorption band increases both with primary corrosion phenomena (ion exchange of alkali ions and calcium ions for protons, with increased ingress of water molecules) and with the secondary processes (the reaction of leached cations with the acid pollutants from the air to form hydrated-sulphate mineral encrustations), infra-red analysis (with extinction at 3300cm-1) constitutes a way of measuring the overall corrosion process.
Analysis was undertaken by comparing the infra-red spectra (with the extinction differences denoted ∆E) and the zero spectra (which were measured for each sensor prior to testing); variations in the thicknesses of the model glasses were also taken into account. The higher the ∆E-values turned out to be, the higher the levels of corrosion at the places where the sensor were sited, with the sensors registering the cumulative effects of corrosion by heat, moisture, noxious substances, and even micro-organisms.
Microscopy
Parallel with the quantitative evaluation by infra-red spectroscopy, research with light microscopy enabled qualitative and semi-quantitative estimates regarding degrees of corrosion to be made. However, the advance of corrosion on model glasses can only be detected with a microscope once a certain level of damage has occurred, namely as soon as corrosion products occur in crystal form, or cracks develop in the gel layer. In addition, examination by microscope was used to check whether the sensor was damaged during exposition or transport, in order to eliminate measurement errors.
The Method for the Glass-Sensor Studies
The sensors (see figs 28 and 29) were fixed with a textile adhesive tape at different heights, either directly on or to the side of the positions indicated in fig. 28 (see further fig. 29). Position 1 measured the impact on the interior face of the original glass, position 2 the micro-climate in the interspace, and 4 the impact on the external face of the protective glazing; position 3 also measures the micro-climate in the interspace, but the results from this position are not considered in detail here. Each of the sensors was left in position for twelve months.
-
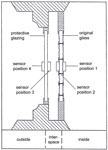
- Fig. 28. Model of an external protective-glazing system indicating the positions of the sensors.
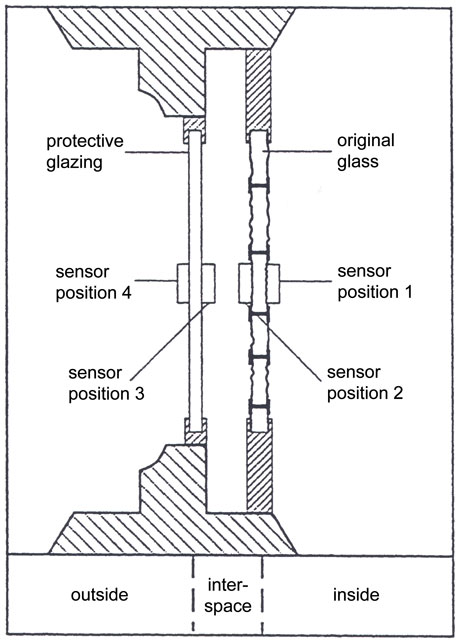
-
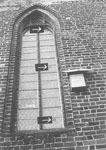
- Fig. 29. Kloster Neuendorf: external view of an external protective-glazing system with sensors.
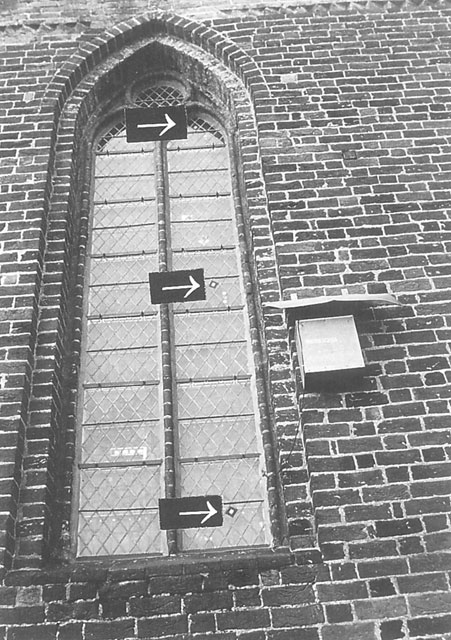
4.2. Results of the Glass-Sensor Studies
The results of measurements taken in situ were discussed in section 3 above, with Keyenberg, Kloster Neuendorf and Cologne discussed in detail. In the interpretation of the results from the glass-sensor measurements that follow, the results from positions 1, 2 and 4 will be the primary focus, and these will be compared with the corresponding in situ measurements from the same annual cycle.
Comparison and Evaluation of External Impacts (Position 4)
From the ∆E-values recorded at position 4 we were able to draw conclusions regarding the different types of environmental impact to which the external face of historical stained glass would be exposed if no protective glazing were fitted. The local climate, the damage wreaked by noxious substances, the orientation of the windows, as well as other local circumstances also played a role in this.
Surprisingly, the highest levels of susceptibility to corrosion in the first survey period (1990-91) were exhibited by the windows surveyed in Keyenberg, despite the church's rural location and the negligible traffic impact - though there is intensive agriculture (cattle-breeding) in the area. The impact of ozone, which can be greater in rural areas than in urban ones, may be a further factor. The ∆E-values here were approximately 0.3. Although Cologne is a large city, the situation was slightly better here, with a ∆E-value of 0.23. Different levels of corrosion were detected in the three churches in Mönchengladbach, whereas Altenberg has the lowest ∆E-values for this survey period (see fig. 30). In addition, the results showed that the impact of corrosion was not evenly distributed across any window: for nearly all the external positions for which measurements were taken, the impact of corrosion was higher towards the top of the window (see fig. 31).
-

- Fig. 30. External impact (average of all heights measured) on windows during the first survey period, 1990-91.
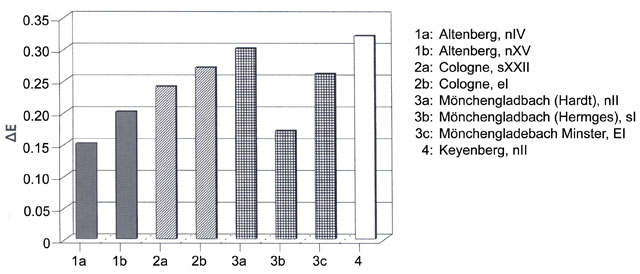
-

- Fig. 31. Distribution of impact according the height at which the sensor was positioned.
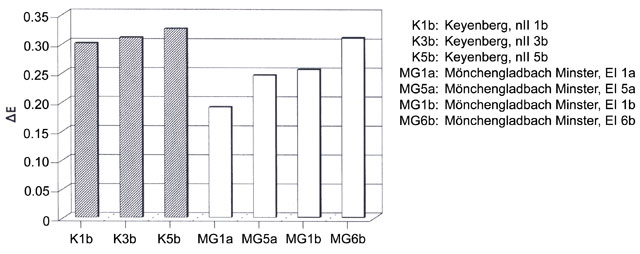
For those windows examined during the second survey period (1991-92) Breinig had the lowest ∆E-value at position 4 (~0.16), whereas Keyenberg, despite its rural location, again had the highest ∆E-values (~0.3), as had been in the case in the first survey period. In Cologne the results were slightly worse than during the previous annual cycle. There was also one peculiarity: the value established for the sensor at the bottom of the south window (panel 1c) was higher than the other values. This finding was explained by the fact that there was a building site outside the cathedral here, with a concrete mixer, compressors, and welding activities. In Rheydt-Giesenkirchen, as in Cologne, the east window suffered slightly less damage than the south window. For a summary of the results, see fig. 32.
-

- Fig. 32. External impact (average of all heights measured) on windows during the second survey period, 1991-92.
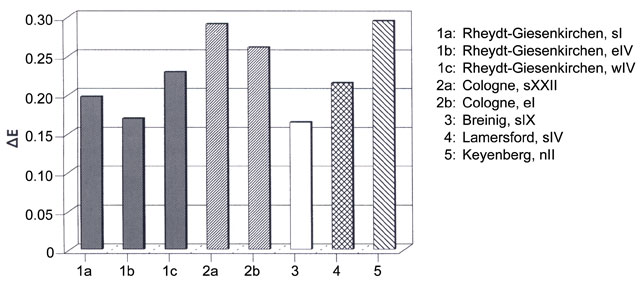
The highest susceptibility to corrosion at position 4 of the 1992-93 survey period was found at the north transept window (NXIII) in Cologne Cathedral, with ∆E-values above 1. An unusually high impact of this level had only been recorded previously in Erfurt (south window sII) during the years 1989-90, when the levels of damage from noxious substances in the inner city were particularly high on account of traffic congestion and emissions from heating systems (Fuchs, Römich and Schmidt 1991). The very high value for the clerestory at Cologne represents an exception, which can perhaps only be explained by the existence of a micro-climate or a local factor (proximity to the railway station?). At Kloster Neuendorf the sensors showed that the impact of external factors there (∆E-values in the range 0.5-0.6) was greater than at comparable churches in the Cologne district, though they were distributed evenly around the whole building complex, with the highest value recorded at the east window eI. The results are presented in fig. 33.
-
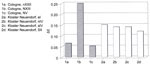
- Fig. 33. Cologne and Kloster Neuendorf: external impact on windows at during the third survey period, 1992-93.
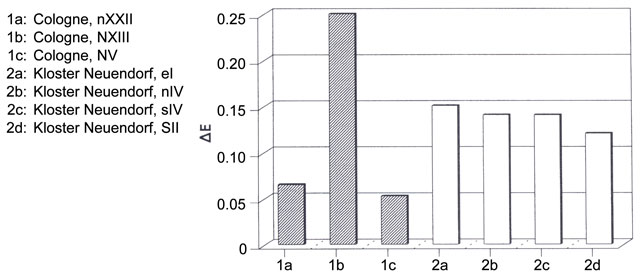
Of the windows studied during the fourth survey period (1995-96), the highest impact of external factors was registered at window nV at the Cathedral of St Mary in Erfurt (∆E of ~0.3). However, this was noticeably lower than the values recorded in Erfurt (∆E of ~0.6 to 1.0) during the 1989-90 study (Fuchs, Römich and Schmidt 1991). Slightly lower ∆E-values were recorded at Wörlitz (~0.25), and the lowest at Augsburg and Wienhausen (~0.14 to 0.16). For Augsburg, these results are surprisingly good, as it is a large city with a lot of car traffic. Again, this survey also showed that for most windows the impact of corrosion was greater further up the window.
Comparison and Evaluation of Internal Impacts (Position 1)
The local situation outside a window partly influences the conditions immediately affecting the internal face of the original glass (position 1). In addition to the intrusion of noxious substances from the outside, overall internal deterioration is determined by other factors, such as heating systems, the number and frequency of visitors, the burning of candles, etc. (fig. 34).
-
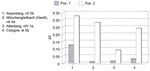
- Fig. 34. Relationship between the internal and external impacts (averaged ∆E-values) on selected windows from the first survey period.
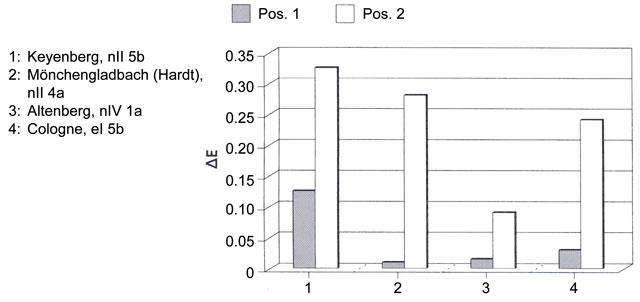
In comparison to Mönchengladbach (Hardt) and other churches of the first survey period 1990-91, very high ∆E-values (of ~0.1) were measured at position 1 on the windows in Keyenberg. This cannot be fully explained by the intrusion of noxious substances from outside: further factors need to be taken into consideration. The other churches detailed in fig. 34 and exhibiting comparable levels of corrosion externally (Altenberg, Cologne) have lower ∆E-values at position 1. At Keyenberg it was evident that the impact of corrosion inside a church was not evenly distributed across any window: the ∆E-values increased from the bottom to the top in each of lights a, b and c (fig. 35).
-
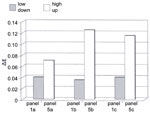
- Fig. 35. Keyenberg: impact of corrosion at position 1 and at different heights in lights a, b and c.
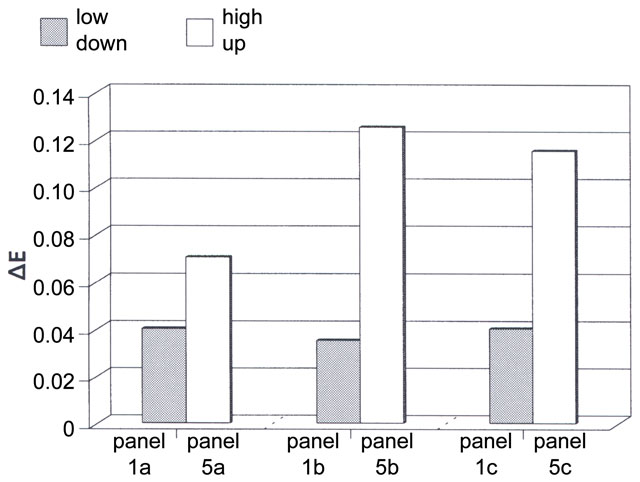
The situation recorded at the east window (eI) of Mönchengladbach Minster was the reverse of that in Keyenberg. There, the impact of corrosion decreased successively from 1a to 7a to 13a (and from 1b to 7b to 13b). A similar situation was recorded at the north window (nII) of Erfurt Cathedral, where the ∆E-values for lights a and b were virtually identical (Fuchs, Römich and Schmidt 1991). At Cologne such trends were not obvious; at the east window (eI) light b was slightly less affected than light a, and at the south window (sXXII) light c was less affected than light a. In comparison with all the other churches surveyed, Altenberg Cathedral had the lowest ∆E-values at position 1, and the impact of corrosion on the internal face of the original glass was thus the lowest; the greatest impact was recorded at Keyenberg (fig. 36).
-

- Fig. 36. Internal impact (averaged ∆E-values) on windows examined during the first survey period, 1990-91.
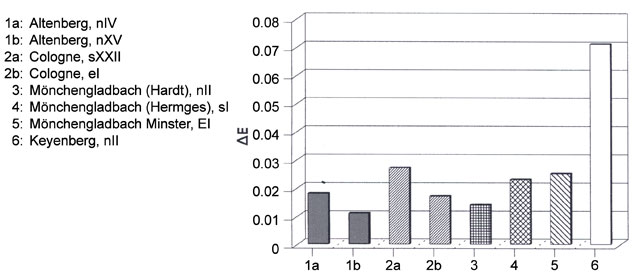
During the second survey period 1991-92, the average values for the impact of corrosion on the internal face of the original glass were slightly higher than in the previous year. In Breinig, the ∆E-values at position 1 were exactly the same as those at position 4, which with hindsight could be explained by the fact that for some of the months during the period in which measurements were taken with sensors, work was carried out at other windows, and the window openings covered with tarpaulin in a rather makeshift manner.
Measurements taken during this survey period also confirmed that the impact on the internal face of the east window (eI) at Cologne was slightly less than that on the south window (sXXII). Less sensitive glass sensors of types M2 and MIII (see Cleaning, table 3) were used in addition to the MI sensors at Keyenberg during the second survey period. Fig. 37 shows that all three types of model glass at Keyenberg indicated the same trend: light c was less affected than light a. Both these lights in turn were less affected than light b, where, in comparison to Cologne, high values were recorded at all heights in the window (1b, 3b and 6b). However, these values were lower than those recorded at Keyenberg in the previous year.
-
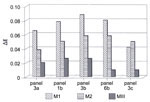
- Fig. 37. Keyenberg: internal impact on lights a, b and c of nII for the survey period 1991-92, measured with different types of glass sensor.
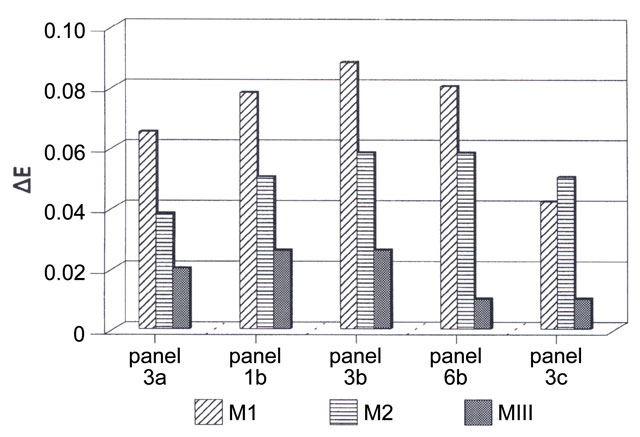
Fig. 38 shows a comparison of the impact on the internal face of the glass measured at Cologne Cathedral and Kloster Neuendorf during the third survey period (1992-93). On average, the values at Cologne were lower than at Kloster Neuendorf, but they were higher than those of previous survey periods at Cologne. The highest value was measured at the north transept window, which also displayed the highest ∆E-value for level of impact externally. The high internal values registered at Kloster Neuendorf can be partly explained by the high external values; in situ measurements further revealed that the relative humidity in the inside the church was extremely high.
-
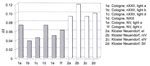
- Fig. 38. Cologne Cathedral and Kloster Neuendorf: internal impacts for the survey period 1991-92.
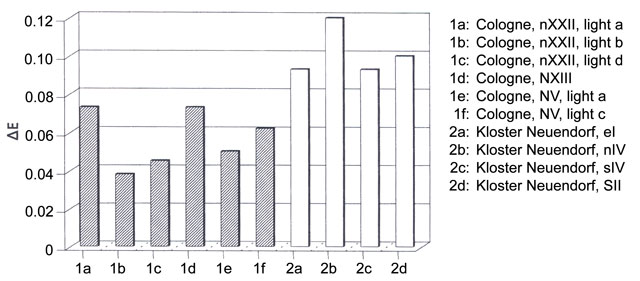
Of the four different windows studied during the fourth survey period, the stained glass in south cell 5 at the monastery in Wienhausen, with a ∆E-value of 0.105, suffered the greatest impact internally (fig. 39). Only Breinig (studied in the 1991-92 survey) was worse affected (with a ∆E-value of 0.17), though this can be explained by the work on adjacent windows, which allowed larger amounts of outside air to intrude. The high value for south cell 5 at Wienhausen could also be explained by the intrusion of larger amounts of outside air, as the room is built entirely out of wood, allowing more air to permeate the structure, unlike the stone-built All Saints Chapel. In addition, harmful substances given off by the wood may have contributed to the high value.
-

- Fig. 39. Wörlitz, Augsburg, Erfurt and Wienhausen: internal impacts.
The impact of corrosion on window sXXVI in the Geistliches Kabinett ('Religious Gallery') at Wörlitz should also be mentioned, with a ∆E-value of 0.053. This window did not have external protective glazing during the survey period. The windows of the Kriegerisches Kabinett ('Military Gallery') have isothermal glazing and exhibit considerably lower ∆E-values for position 1 of ~0.035. This demonstrates that the installation of protective glazing not only prevents considerable variation in the interior temperature, but also reduces the corrosive impact of remaining factors on the internal face of the original glass.
Comparison and Evaluation of the Effectiveness of Different Protective-Glazing Systems (Impact at Position 2)
The effectiveness of protective glazing is determined mainly by the microclimate in the interspace between the original glass and the protective glazing. The performance of the external protective glazing is determined, depending on the type of ventilation, by the climate outside; the air inside; and satisfactory air circulation between original glass and the protective glazing. In general it may be said that the protective glazing that offers the best protection is that for which the glass sensors at position 2 (recording the micro-climate in the interspace) achieve the lowest ∆E-values. However, the impact of corrosion at the other positions has to be taken into account: there are types of protective glazing for which the impact in the interspace is very low, but the ∆E-values at positions 1 and 4 very high. From a theoretical point of view, this type of protective-glazing system has a better and more positive effect than those that exhibit low ∆E-values both at position 2, and at positions 1 and 4.
Simple estimates on the overall protective effect can be made with the help of the following equation, with OPEN being the overall protective effect number. The higher the OPEN-value, the more effective the protective glazing (Leissner and Fuchs 1992a; Leissner and Fuchs 1992b):
-
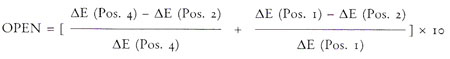
- equation
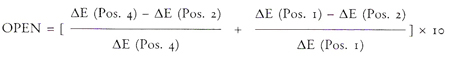
What follows is a discussion of the data recorded by glass sensors at position 2 and the corresponding OPEN-values of windows studied during the different survey periods. The protective-glazing systems at Keyenberg, Cologne and Neuendorf are taken as primary examples, as the results of the in situ measurements taken in these places were described in section 3.
The results from the protective-glazing systems at Keyenberg with external ventilation (nII, light b) and internal ventilation (nII, light c) from the first survey period (1990-91) are shown together in fig. 40. The ∆E-values for the externally ventilated system showed that at the internal position 2 on panel 1b, close to the ventilation slits, a similarly high impact was experienced as at the external position 4. The OPEN-value for this construction was -17, which means that the protective-glazing system afforded only a very low level of protection. The internally ventilated protective-glazing system at light c resulted in ∆E-values at position 2 that were even lower than those at position 1. If one works out the OPEN-value, this system comes out with the highest value (16) registered during this survey period. All other glazing systems that were tested at the same time (for example mixed-ventilation systems at Altenberg and Mönchengladbach) achieved results that lie between these two extremes. The two internally ventilated protective-glazing systems in Cologne (at windows sXXII and eI) achieved lower OPEN-values (11) than the internally ventilated system at Keyenberg, though compared with the overall results, this can be interpreted as a very satisfactory level of protection.
-

- Fig. 40. Keyenberg, nII: comparison of the impact in the interspace (position 2), with internal impact (position 1) and external impact (position 4) for internally ventilated (light c) and externally ventilated (light b) protective-glazing system for the survey period 1990-91.
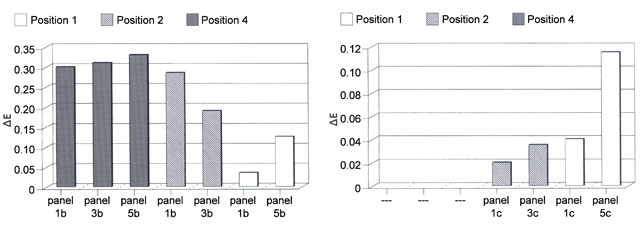
During the second survey period, changes were made to the systems in Cologne and Keyenberg (see section 2), and at Keyenberg light a of nII was also fitted with mixed-ventilation protective glazing. Fig. 41 compares the results of the three different types of installation in Keyenberg. The impact on the glass at position 2 was greater with the externally ventilated system in light b than at position 4. The corresponding OPEN-value can be calculated as -36, considerably worse than that for the first survey period.
-
- Fig. 41. Keyenberg, nII: comparison of the impact in the interspace (position 2), with internal impact (position 1) and external impact (position 4) for internally ventilated (light c) and externally ventilated (light b) protective-glazing system for the survey period 1991-92.
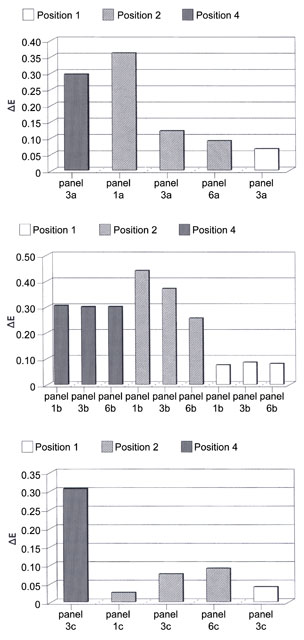
The small structural alterations to the internally ventilated system in light b also contributed to a worsening of the situation in comparison with the first survey period: the OPEN-value fell from 16 in the first survey period to 8. This time the ∆E-values for the sensors at position 2 were noticeably higher than those at position 1. The values for sensors at position 2 varied greatly for the mixed-ventilation system, where the greatest impact in the interspace was measured in the lower part of the light a (panel 1a). Here air was brought in from the outside to ventilate the interspace. The level of protection calculated from these values (an OPEN-value of -16) was unsatisfactory.
It was particularly interesting to follow the changes in impact resulting from structural alterations to the protective-glazing systems at the south and east windows in Cologne (sXXII and eI). The ventilation slits were widened from 0.5cm to 5cm for the whole width of the window. If one calculates the ∆E-values at position 2 (averaging out the values for different heights, as well as those for the centres and edges of the panels) and the associated OPEN-values, one can compare the effectiveness of the different protective-glazing systems (fig. 42).
-
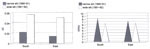
- Fig. 42. Cologne, south and east windows: comparison of the results (by means of ∆E-values at position 2 as well as OPEN-values), before and after changes to the construction of the protective-glazing systems.
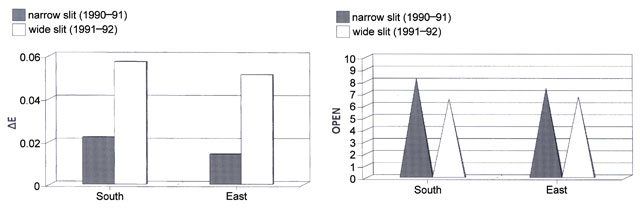
The higher ∆E-values for larger clips at the south and east window reflected the higher level of impact in the interspace for this type of construction. The OPEN-values, which give the impact in the interspace in relation to the internal and external impacts, confirm this result, though the difference is not as clear. The somewhat higher OPEN-values achieved with small slits indicate that this type of protective-glazing construction affords higher levels of protection. At both windows in Cologne, the centre of the light was on average more affected than the edge; this trend is even more pronounced at the south window than at the east window (see fig. 43). In addition it was possible to observe for the south and east windows that measurements from sensors at greater heights produced higher ∆E-values.
-
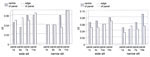
- Fig. 43. Cologne, east window (lights a and b) and south window (lights c and a): comparison of the impact in the interspace (position 2) at different positions (in the centre, to the side) and at different heights (panel 1, panel 10 or 11).
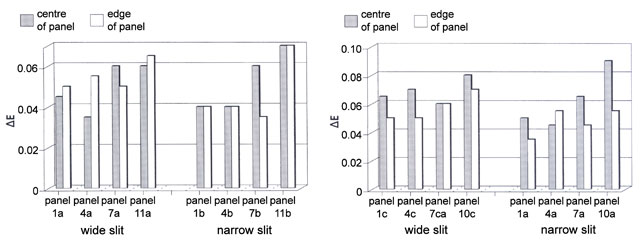
During the third survey period, the effects of structural changes were again compared, this time for the north choir window (NV) at Cologne Cathedral. The ventilation slits at the lower window sills were implemented differently for the internally ventilated system. The lowest ∆E-values (0.031) were achieved by the protective glazing with very small ventilation slits at the bottom, and the highest (0.045) by the protective glazing with the largest gaps; ∆E-values in the mid-range (0.036) were achieved with ventilation slits of medium size. These results correlate well with the atmospheric-pollution measurements undertaken at this window, which indicated that more SO2 and NO2 gain access to the interspace of the protective-glazing system with 4cm-wide slits than to the interspaces of the systems with 2cm- or 0.5cm-wide slits (Kirchner and Bruggerhoff 1994). In principle, all three versions of the external protective-glazing system work efficiently, and the micro-climate in the interspace is less corrosive than at positions 1 and 4; this is also reflected in the OPEN-values, as these lie in the range between 10 and 12, normally associated with efficient systems.
The reduction in levels of corrosion to the external face of the original glass at the north transept window (NXIII), with internally ventilated protective glazing, was very good when compared with the extremely high values registered at external position 4. The OPEN-value is 15, which is very efficient. However, the internally ventilated system at light a of the north choir window (NV) worked less efficiently. The ∆E-value was 0.058 at position 2, thus slightly higher than at comparable positions in Cologne; the OPEN-value is correspondingly low, at 5.6. Light c of the north choir window was fitted with an externally ventilated system. As with all the other externally ventilated systems studied, position 2 produced values that were much higher than those produced by position 1, but distinctly lower than those at position 4. Unlike Keyenberg, where the value for positions 2 and 4 were nearly identical, this externally ventilated system achieved a certain level of protection, despite the fact that the impact in the interspace constituted a potential threat to the original glass. The OPEN-value for the externally ventilated system at Cologne was a positive value of 3.4, clearly better than that for the externally ventilated system at Keyenberg.
At Kloster Neuendorf all the protective-glazing systems surveyed produced lower values for the interspace than at position 1. The external face of the original glass fared much better when protected compared with original glass that was unprotected. Even so, all values at position 2 were higher than 0.05, which means that in the long term there will be further corrosion of the original glass. The effectiveness of all the protective-glazing systems studied during the third survey period is given in fig. 44.
-
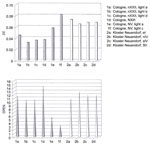
- Fig. 44. ∆E-values at position 2 and the OPEN-values for all windows of the third survey period (1f externally ventilated, all others internally ventilated).
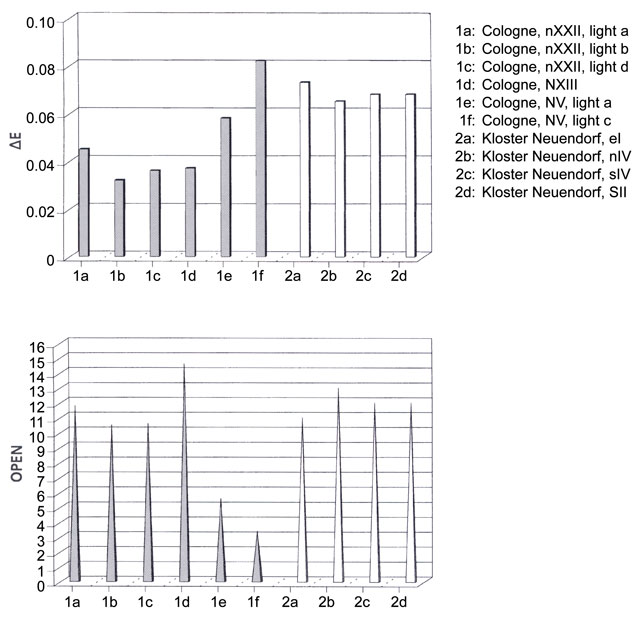
During the fourth survey period, only internally ventilated systems were studied. At Augsburg Cathedral it was interesting to compare the efficiency of the internally ventilated system (with interspace heating) installed at the window with the prophet Hosea with that (without interspace heating) installed at the window with the prophet David. For the system with a heated interspace, the level of corrosion on the external face of the glass was very low, with glass sensor at position 2 registering an average value of 0.026; however, the situation with the system with an unheated interspace, was only slightly worse, with the glass sensor at position 2 registering an average value of 0.03, and the impact being equally low at the top and bottom of the light. When calculating the overall level of protective afforded with OPEN values, the heated system (with an OPEN-value of 5) was not as good as the unheated version (which achieved an OPEN-value of 9).
In the past, there was always controversy over the efficiency of systems with heated interspaces. By using OPEN-values, it can now be demonstrated for the first time that the overall efficiency of this type of protective-glazing system lies in the medium range of all the systems examined to date. Since the corrosion values at position 2 of the two windows surveyed in Augsburg are relatively small, it appears that heating does not pose an increased risk to the original glass, though its installation does not seem to bring any advantages.
4.3. Evaluation of the Complete Results
In what follows, all the external protective-glazing systems studied will be compared. The ∆E-values from the glass sensors that were positioned in the interspace will be discussed in relation to the corresponding values for the interior of the building (positions 2 and 1). The OPEN-value is calculated for all protective-glazing construction types, thus establishing the level of protection afforded in relation to the outside climate.
Figs 45 and 46 relate to particular forms of protective glazing. The data show that a non-ventilated, sealed, external protective-glazing system, such as that installed for the south window at Breinig, increases the level of corrosion to the original glass in the interspace, thereby posing an additional threat. Only low levels of efficiency were achieved with the externally ventilated system at Keyenberg (nII, light c), and the structural alterations undertaken during the second survey period only made things worse. The results tally with those of a sensor study carried out on a non-ventilated and an externally ventilated system at the Großmünster in Zürich (Leissner and Fuchs 1992a and 1992b). However, the externally ventilated system at Cologne proved an exception: the value at position 2 was only slightly higher than that at position 1, indicating a good level of protection.
-

- Fig. 45. Comparison of the ∆E-values for the interiors of buildings (position 1) and the interspace (position 2) for all protective-glazing systems, with external ventilation (3a, 3c, 4), mixed ventilation (1a, 1b, 3b, 5), and no ventilation systems (2).
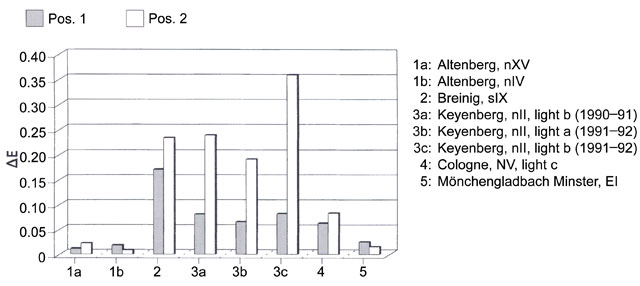
-

- Fig. 46. Comparison of the OPEN-values of all protective-glazing systems, with external ventilation (3a, 3c, 4), mixed ventilation (1a, 1b, 3b, 5), and no ventilation (2).
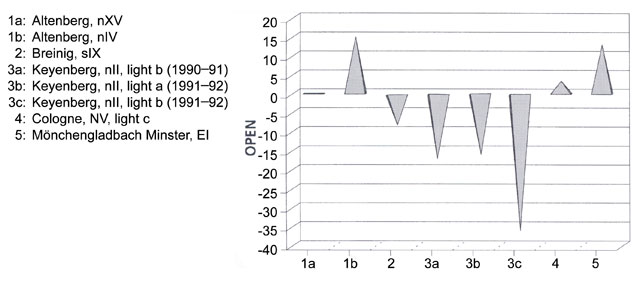
The mixed-ventilation systems in Altenberg (nIV) and at Mönchengladbach Minster afforded surprisingly high levels protection: the ∆E-values at position 2 for both windows were on average lower than those for the interior. Overall, window nXV at Altenberg had a higher ∆E-value at position 2 (0.02) than at position 1 (0.01); the OPEN-value is therefore negative. However, because of the very low ∆E-value at position 2, one has to bear in mind again the small threat to the original glass. The special mixed-ventilation system installed at light a in Keyenberg in 1991 (ventilated by external air passing in at the bottom and out into the church at the top) achieved only unsatisfactory levels of protection (with an OPEN-value of -16). All mixed-ventilation systems had distinctively higher ∆E-values in the lower parts of the interspace than at the upper ones (with noxious substances brought in by the outside air). The data for these particular systems is given in figs 45 and 46.
The levels of protection afforded by the internally ventilated systems studied differed greatly. They can be classified into three groups, depending on whether the micro-climate in the interspace was better, worse, or about equal to that indicated by the values for corrosion levels at position 1. In addition, the systems had to fulfil certain criteria in relation to the outside climate (the OPEN-values).
1. Internally ventilated systems in the first group worked very efficiently, with the impact of corrosion in the interspace lower than that inside of church (i.e., with the ∆E-value at position 2 lower than that at position 1, and with the OPEN-value higher than 9). These protective-glazing systems are especially efficient, and the data for them are given in figs 47 and 48.
-

- Fig. 47. Comparison of the ∆E-values for the interiors of buildings (position 1) and the interspace (position 2) for particularly efficient internally ventilated protective-glazing systems.
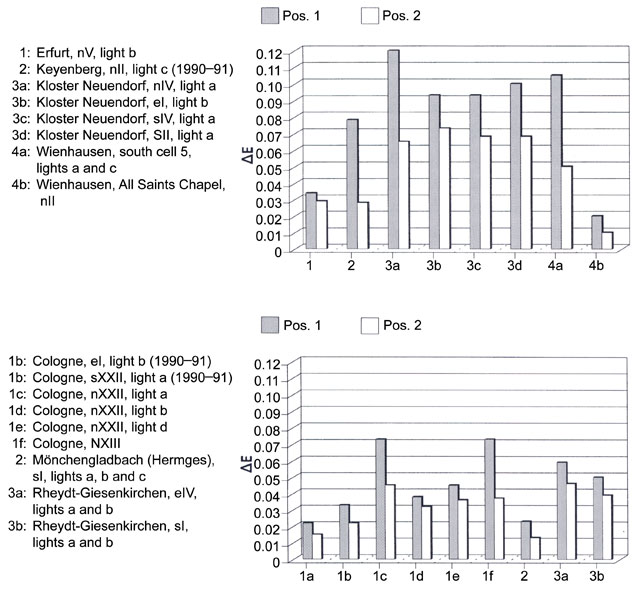
-
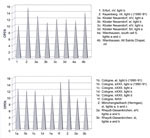
- Fig. 48. Comparison of the OPEN-values for particularly efficient internally ventilated protective-glazing systems.
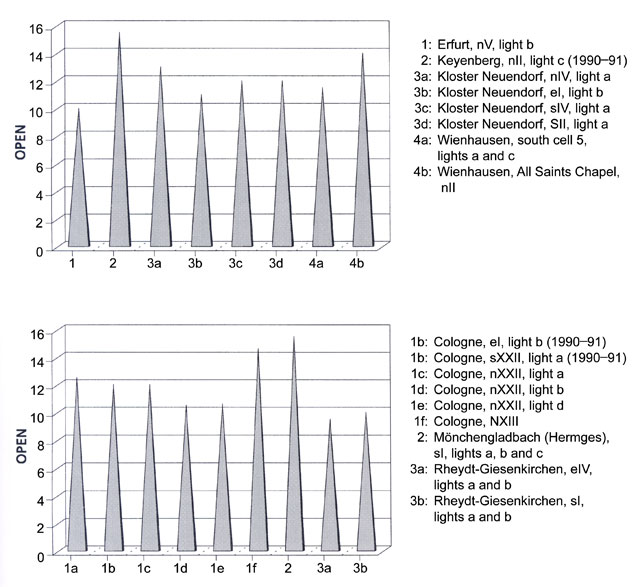
2. If the impact of corrosion in the interspace is about equal to that inside the building, the level of protection afforded is moderate (i.e., with the ∆E-value at position 2 about equal to that at position 1, and the relevant OPEN-value in the medium range, 6-9). The data for these systems is given in figs 49 and 50.
-

- Fig. 49. Comparison of ∆E-values for the interiors of buildings (position 1) and the interspace (position 2) for less efficient internally ventilated protective-glazing systems.
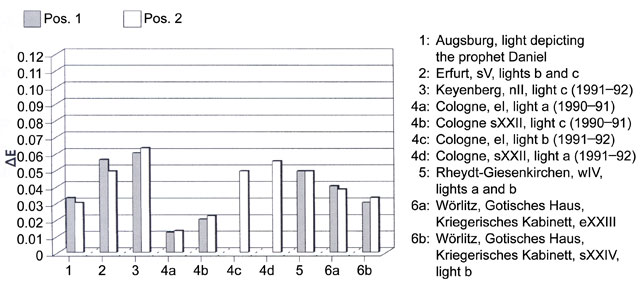
-

- Fig. 50. Comparison of the OPEN-values for less efficient internally ventilated protective-glazing systems.
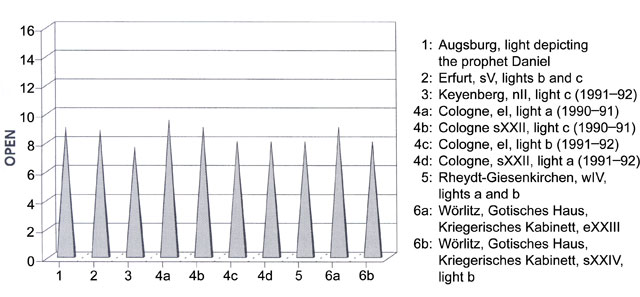
3. Where the internally ventilated protective-glazing systems were less efficient, they had higher levels of corrosion in the interspace than in the interior (i.e., with the ∆E-value at position 2 higher than that at position 1, and the OPEN-value lower than 6). The data for these systems is given in figs 51 and 52.
-

- Fig. 51. Comparison of the ∆E-values for the interiors of buildings (position 1) and interspace (position 2) for non-optimal internally ventilated systems.
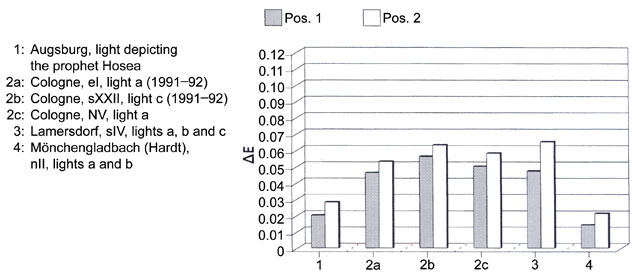
The boundaries between these three groups are not clear cut.
-

- Fig. 52. Comparison of the OPEN-values for non-optimal internally ventilated systems.
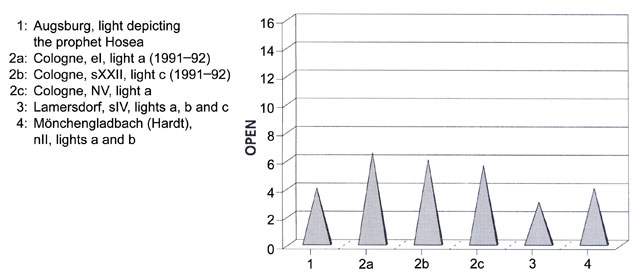
The influence of the size of the ventilation slits was studied at the windows in Cologne Cathedral. The results showed that an increase in the size of the lower slits from 0.5cm to 4cm, with the width of the upper slit remaining constant at 1cm, led to increased levels of corrosion in the interspace. This can be explained by the increased levels of noxious substances entering the interspace.
In summary, the glass-sensor studies allowed us to draw the following conclusions.
The externally ventilated protective-glazing system at Keyenberg, the non-ventilated system at Breinig, and the special mixed-ventilation system at Keyenberg offered no protection whatsoever compared with the glass in its original state with no protective glazing. Indeed, they may well have constituted an additional corrosive threat to the stained glass. All other protective-glazing systems afforded levels of protection that mitigated the effects of corrosion peculiar to specific locations. However, there were considerable differences in the levels of protection afforded. The results of the glass-sensor studies made it clear that environmental circumstances of every building and every window are unique, and cannot be accounted for with a generalized model. Although general trends can be detected, the only safe and realistic way to judge the level of corrosion to stained glass (even with a protective-glazing system installed) is on a case-by-case basis. Glass-sensor measurements proved a suitable aid for making such judgements.
The next section examines whether the measurements taken in situ tally with the results of the glass-sensor studies, and discusses the discrepancies.
5. Assessment of the Results of the In Situ Surveys and the Glass-Sensor Studies
5.1. Environmental Influences on Historical Stained Glass
Environmental influences can cause great damage to stained glass. When judging a window's requirements in relation to the installation of protective glazing, the preservation of its glass and its visual impact, a complex of interrelated possibilities for corrosion to the glass and the paint applied to it has to be taken into consideration. Particular attention has to be paid to the relative humidity, as moisture is generally the decisive factor in facilitating the onset of corrosion. Laboratory experiments proved that an increase in relative humidity at a constant temperature effected an acceleration in the processes of corrosion. However, there is no agreement as to the existence of a threshold below which sensitive glass can be preserved safely. Condensation on the face of any glass is without question extremely damaging, and even humidity factors below 80% can lead to damage to stained glass.
In general, increased temperatures speed up chemical reactions such as corrosion. However, with an increase in temperature the possibility of condensation forming decreases. An increase in temperature thus has two opposite effects: on the one hand it speeds up the corrosion process, on the other, it mitigates the damaging effects of humidity. Badly corroded glass suffers even worse from variations in temperature and humidity, as both can cause fine cracks to form in the gel layer and fragments to break off the surface of the glass.
Atmospheric pollution also has a decisive influence on the progress of glass corrosion. Apart from sulphur dioxide, nitric oxides and ozone have an deleterious effect on the glass, especially in combination with humidity. The harmful effects of microbial growth on glass was underestimated for a long time, as the resultant corrosive phenomena cannot be traced to a biological source without specialized study.
The influence of light does not play an important role with regard to glass corrosion, except for the browning that occurs in manganese glasses. However, it is still desirable for conservationists to ensure protection from ultraviolet rays, in order to slow down the ageing process of the materials used for conservation (glue, paint-layer fixatives, and paint used for retouching).
5.2. Accounting for Environmental Factors
In principle, all environmental factors identified have to be taken into consideration when assessing externally ventilated protective-glazing systems; in practice, however, this is impossible. In situ data collection and glass-sensor studies are two different approaches for assessing the environmental factors affecting stained glass. Their potential and shortcomings are discussed here.
In situ data collection allows the following factors to be considered: air temperature and humidity (inside a building and in the interspace); glass temperature (of original glass and on the internal face of the protective glazing); and air velocity in the interspace. The levels of condensation forming on the glass surfaces were calculated from the relative humidity and glass temperature.
Recording atmospheric pollution at any location involves great expenditure and was not considered for this project. In one case, a new method of recording the deposition of noxious substances was tested, but this was only at a developmental stage at the time. At the start of the project, no practical method for assessing microbial growth was available.
The diversity of data collected from in situ measurements had to be rendered in summary form to be evaluated, and it is difficult to draw any conclusions on the significance of peak values reached for brief period (e.g., maximum humidity values on particular days). When considering annual average values, it is almost impossible to draw conclusions, as the data for different protective-glazing systems show no significant discrepancies.
As was outlined in section 3, protective-glazing systems were assessed mainly through the cumulative frequency of relative humidity, i.e., by looking at the frequency with which certain levels of humidity occurred, taking especial note of the danger posed by condensation. It was not possible to take other factors significant in the corrosion of glass (such as the concentration of noxious substances in the atmosphere) into consideration.
Unlike the in situ measurements described above, glass sensors do not register individual values, but the combined influences of the environment on sensitive glass. If a particular sensor study produces a high value, it may denote a potential risk, but it will not identify its causes; however, individual peaks in temperature and humidity are not decisive factors. Glass sensors can provide results for the whole period during which they were in position, and record the effects of fluctuations in temperature and humidity on sensitive glass.
The potassium-lime silicate glass used for glass sensors constituted the best possible approximation to historical glass. However, it should be noted that glasses of different chemical make-up can react very differently to specific environmental factors, such as humidity or noxious gases. Glass sensors allow environmental factors to be assessed in an integral manner and supply numeric values that are easy to interpret.
5.3. Comparison of the Data Collected from In Situ Surveys and Glass-Sensor Studies
This project allowed the results from in situ data collection and glass-sensor studies to be compared for the first time. In what follows, the parallels and divergences that may be detected when assessing the interior climate and different ventilation systems are drawn up; the corrosiveness of the exterior climate can only be estimated by means of glass-sensor data.
Assessment of the Interior Climate
As a result of the in situ data collection, the interior climate at Kloster Neuendorf was judged to be particularly unfavourable for the preservation of stained glass. The relative humidity values in the interior were 76% on average, which is distinctively higher than at Keyenberg (61-64%) or Cologne (63-67%). The values derived from glass-sensor data at position 1 in Neuendorf were higher (~0.09) than comparable ones at Cologne (around 0.05) from the same survey period, thereby confirming the results of the in situ data collection. At two points inside the church at Keyenberg ∆E-values peaked at 0.12 during the first survey period; the average values during the second period were still relatively high, at 0.08.
The high values derived from glass-sensor data were explained by the fact that at both Keyenberg and Kloster Neuendorf, the external ∆E-values (position 4) were relatively high. The intrusion of noxious substances from the outside may have caused the interior climate to deteriorate. This could not be followed up with through in situ data collection, as no measurements of were taken of the levels of noxious substances.
Assessment of Protective-Glazing Systems with External Ventilation and Mixed Ventilation
All the externally ventilated systems could be classified as inferior to the internally ventilated ones from the data collected in situ, using the frequency with which condensation formed as the criterion. A further criterion was that with internally ventilated systems, condensation formed on the surface of the protective glazing, whereas with external ventilated systems, it formed on the inside and outside faces of the original glass. Moreover, the fluctuations in temperature of the original glass were more extreme than with externally ventilated systems (e.g., at Keyenberg, -5°C to 30°C) than with internally ventilated ones (+5°C to 30°C). In comparing internally and externally ventilated systems, the externally ventilated system at Keyenberg was found to be less effective (with a condensation factor of 0.01%) than the one at Cologne (where no condensation was registered).
The trends indicated by the results of the glass-sensor studies were similar: the externally ventilated system in Keyenberg had an OPEN-value of -36 (during the second survey period), and -17 (during first survey period), thus offering practically no protection. The version installed in the clerestory at Cologne had an OPEN-value of 3, similar to that achieved by internally ventilated systems.
Assessments show that mixed-ventilation systems occupy a middle ground. The glass-sensor studies did however show that protection is not evenly distributed across the whole of the window, and is particularly unsatisfactory at the point where external air enters.
Variation in the Size of Ventilation Slits in Internally Ventilated Protective-Glazing Systems
A high tendency for condensation to form on the protective glazing (a factor of 12%) was detected at the east window (eI) of Cologne Cathedral. After the ventilation slits were enlarged, this factor was reduced to 4% in the following year. However, the glass-sensor values at position 2 increased after this structural alteration, from 0.014 to 0.051. A similar tendency was noted at the south window sXXII, after the slits were enlarged. Since air velocity in the interspace can be observed to increase with larger slits, increased levels of noxious substances can again be reckoned to be entering the interspace.
At the north window nXXII of Cologne Cathedral protective-glazing systems with slits of different sizes were installed at the same time at lights a, b and d. Again, the in situ data showed that larger slits at the bottom (4cm) were moiré advantageous than the smaller ones (<0.5cm). A compromise seems to be the answer, as condensation factors drops from 7% to 4% when the width of the slits is increased from 0.5cm to 2cm, but further enlargement of the slits, to 4cm, improves the situation only slightly, reducing the factor to 3%. For this window the values derived from the glass-sensors showed hardly any difference, with all the OPEN-values falling in the range 10-12, a range denoting efficiency for the protective glazing; the opposite situation arose with the south and east windows, where smaller gaps gave better results.
The Influence of Window Orientation
As the temperature in the interspace is influenced by the number of hours of sunshine, so it was to be expected that glass-sensor measurements would bring very different results for structurally similarly but differently oriented windows. For example, the data collected in situ at the south window (sXXII) in Cologne Cathedral showed that there was a lesser tendency for condensation to form here than at the east window (eI). However, the corresponding glass-sensor studies do not confirm this picture; indeed, no important differences were detected between the glass-sensor measurements taken at Kloster Neuenburg, where north-, east-, and south-facing windows were surveyed. Clearly the effects of a window's orientation can be obscured by other factors (such as whether the window is sealed, how large it is, the effect of shade outside), among which air circulation in the interspace has a decisive influence.
Summary
In situ data collection and glass-sensor studies are two different methods for assessing external protective glazing. Identical or similar recommendations can often be derived from both methods. Differences can occur, especially where noxious substances play a significant role, since until now it has not been possible to measure the effects of this with in situ data collection. Furthermore, in situ data collection showed how much the relative humidity of the climate inside a church can vary, depending on whether the building is heated or unheated. The parallel glass-sensor studies registered no significant differences; this can be explained by the fact that the glass sensors do not register relative humidity in isolation, but in combination with the effect of harmful gases. Sensors are therefore able to detect what purely climate measurements cannot, namely the risk potential posed by local sources of noxious substances.
As demonstrated at Keyenberg, the glass-sensor studies also indicated that the level of protection afforded by a particular protective-glazing system can differ from one year to the next, even if no structural alterations are made. Here, a rise in the temperature inside the building resulted in increased air velocity in the interspace, which in turn lessened the tendency for condensation to form; the glass sensors registered this change.
In every case, the assessment of a protective-glazing system needs to be founded on a sufficiently broad base of data. The frequency with which condensation forms, on the original glass as well as on the protective glazing, should to be measured or calculated, and the average (as well as the highest and lowest) values for temperature and humidity need to be considered for their effect on stained glass. As far as glass-sensor measurements are concerned, there is an absolute minimum of data required for comparison purposes: apart from the minimum requirement of sensors in one location (at positions 1, 2 and 4), it is advisable also to install sensors at different heights in the window, and if possible also in neighbouring windows.
Furthermore, it is essential to consider data from a year's cycle. Any disturbance to the internal climate, for instance through work on other windows, should be avoided, in order not to influence the data from the sensors.
However, in general it may be said that the techniques used to assess the installation and conservation needs of stained glass should be refined further, in order to ensure that windows are conserved in the best possible fashion in the long term.
6. Acknowledgements
Authors: Stefan Oidtmann, Johanna Leissner, Hannelore Römich. This text originally appeared as chapter 7, 'Schutzverglasungen' (pp. 167–209), in A. Wolff (ed.), Restaurierung und Konservierung historischer Glasmalereien, Mainz, 2000.
Publisher: Verlag Philipp von Zabern.
Translators: Steffani Becker-Hounslow, Joseph Spooner, Sebastian Strobl.
Images: S. Oidtmann, Glasmalerei Dr. H. Oidtmann, Linnich (figs 1–27); Fraunhofer-Institut für Silicatforschung (ISC), Würzburg, Außenstelle Bronnbach (figs 28–52).